Getting Started with ASP.NET Core 3D Circular Chart Control
26 Dec 20256 minutes to read
This section briefly explains about how to include ASP.NET Core 3D Circular Chart control in your ASP.NET Core application using Visual Studio.
Prerequisites
System requirements for ASP.NET Core controls
Create ASP.NET Core web application with Razor pages
Install ASP.NET Core package in the application
To add ASP.NET Core controls in the application, open the NuGet package manager in Visual Studio (Tools → NuGet Package Manager → Manage NuGet Packages for Solution), search for Syncfusion.EJ2.AspNet.Core and then install it. Alternatively, you can utilize the following package manager command to achieve the same.
Install-Package Syncfusion.EJ2.AspNet.Core -Version 34.1.29NOTE
Syncfusion® ASP.NET Core controls are available in nuget.org. Refer to NuGet packages topic to learn more about installing NuGet packages in various OS environments. The Syncfusion.EJ2.AspNet.Core NuGet package has dependencies, Newtonsoft.Json for JSON serialization and Syncfusion.Licensing for validating Syncfusion® license key.
Add Syncfusion® ASP.NET Core tag helper
Open ~/Pages/_ViewImports.cshtml file and import the Syncfusion.EJ2 TagHelper.
@addTagHelper *, Syncfusion.EJ2Add script resources
Here, script is referred using CDN inside the <head> of ~/Pages/Shared/_Layout.cshtml file as follows,
<head>
    ...
    <!-- Syncfusion ASP.NET Core controls scripts -->
    <script src="https://cdn.syncfusion.com/ej2/34.1.29/dist/ej2.min.js"></script>
</head>
NOTE
Checkout the Adding Script Reference topic to learn different approaches for adding script references in your ASP.NET Core application.
Register Syncfusion® script manager
Also, register the script manager <ejs-script> at the end of <body> in the ASP.NET Core application as follows.
<body>
    ...
    <!-- Syncfusion ASP.NET Core Script Manager -->
    <ejs-scripts></ejs-scripts>
</body>
Add ASP.NET Core 3D Circular Chart control
Now, add the Syncfusion® ASP.NET Core 3D Circular Chart tag helper in ~/Pages/Index.cshtml page.
<ejs-circularchart3d id="container" title="Browser Market Shares in November 2023" tilt="-45">
    <e-circularchart3d-legendsettings visible="true" position="@Syncfusion.EJ2.Charts.LegendPosition.Right">
    </e-circularchart3d-legendsettings>
    <e-circularchart3d-series-collection>
        <e-circularchart3d-series dataSource="@circularData" xName="X" yName="Y">
            <e-circularchart3d-series-datalabel visible="true" name="X"
            position="@Syncfusion.EJ2.Charts.CircularChart3DLabelPosition.Outside">
                <e-font fontWeight="600"></e-font>
                <e-connectorstyle length="40px"></e-connectorstyle>
            </e-circularchart3d-series-datalabel>
        </e-circularchart3d-series>
    </e-circularchart3d-series-collection>
</ejs-circularchart3d>
Pie Series
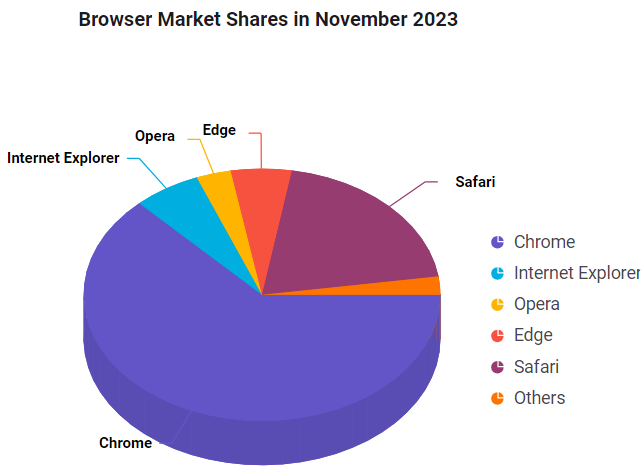
By default, the pie series will be rendered when assigning the JSON data to the series using the dataSource property. Map the field names in the JSON data to the xName and yName properties of the series.
@{
    ...
    List<CircularChartData> circularData = new List<CircularChartData>
    {
        new CircularChartData { X = "Chrome",            Y = 62.92 },
        new CircularChartData { X = "Internet Explorer", Y = 6.12  },
        new CircularChartData { X = "Opera",             Y = 3.15  },
        new CircularChartData { X = "Edge",              Y = 5.5   },
        new CircularChartData { X = "Safari",            Y = 19.97 },
        new CircularChartData { X = "Others",            Y = 2.34  }
    };
}

<ejs-circularchart3d id="container" title="Browser Market Shares in November 2023" tilt="-45">
    <e-circularchart3d-legendsettings visible="true" position="@Syncfusion.EJ2.Charts.LegendPosition.Right">
    </e-circularchart3d-legendsettings>
    <e-circularchart3d-series-collection>
        <e-circularchart3d-series dataSource="@circularData" xName="X" yName="Y">
            <e-circularchart3d-series-datalabel visible="true" position="@Syncfusion.EJ2.Charts.CircularChart3DLabelPosition.Outside" name="X">
                <e-font fontWeight="600"></e-font>
                <e-connectorstyle length="40px"></e-connectorstyle>
            </e-circularchart3d-series-datalabel>
        </e-circularchart3d-series>
    </e-circularchart3d-series-collection>
</ejs-circularchart3d>
...
public class CircularChartData
{
public string X;
public double Y;
}Press Ctrl+F5 (Windows) or ⌘+F5 (macOS) to run the app. Then, the Syncfusion® ASP.NET Core 3D Circular Chart control will be rendered in the default web browser.
NOTE
View Sample in GitHub.