How can I help you?
Getting started with Angular Pivotview component
12 Jun 20267 minutes to read
This guide demonstrates how to set up and configure the Syncfusion Angular Pivot Table component, from initial installation through creating a functional pivot table for data analysis.
Note: This guide supports Angular 21 and other recent Angular versions. For detailed compatibility with other Angular versions, please refer to the Angular version support matrix. Starting from Angular 19, standalone components are the default, and this guide reflects that architecture.
Ready to streamline your Syncfusion® Angular development? Discover the full potential of Syncfusion® Angular components with Syncfusion® AI Coding Assistant. Effortlessly integrate, configure, and enhance your projects with intelligent, context-aware code suggestions, streamlined setups, and real-time insights—all seamlessly integrated into your preferred AI-powered IDEs like VS Code, Cursor, Syncfusion® CodeStudio and more. Explore Syncfusion® AI Coding Assistant
To get started quickly with Angular Pivot Table, you can watch this video:
Prerequisites
Ensure your development environment meets the System Requirements for Syncfusion® Angular UI Components.
Setup the Angular application
A straightforward approach to beginning with Angular is to create a new application using the Angular CLI. Install Angular CLI globally with the following command:
npm install -g @angular/cliAngular 21 Standalone Architecture: Standalone components are the default in Angular 21. This guide uses the modern standalone architecture. If you need more information about the standalone architecture, refer to the Standalone Guide.
Create a new application
With Angular CLI installed, execute this command to generate a new application:
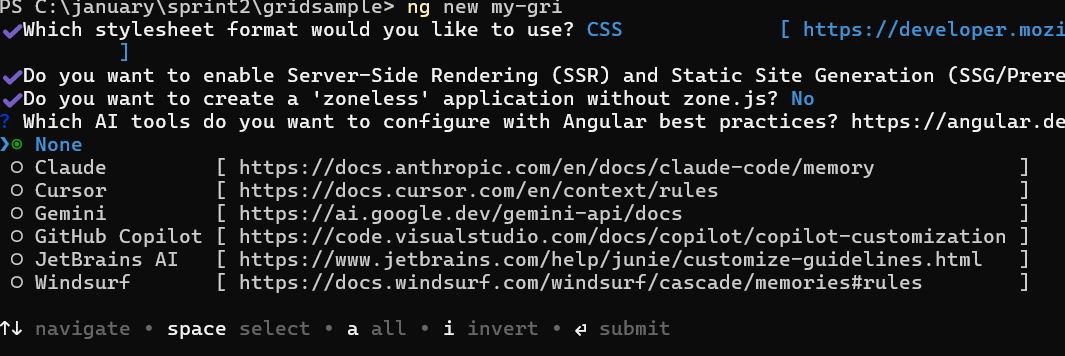
ng new syncfusion-angular-app- This command will prompt you to configure settings like enabling Angular routing and choosing a stylesheet format.
? Which stylesheet format would you like to use? (Use arrow keys)
> CSS             [ https://developer.mozilla.org/docs/Web/CSS                     ]
  Sass (SCSS)     [ https://sass-lang.com/documentation/syntax#scss                ]
  Sass (Indented) [ https://sass-lang.com/documentation/syntax#the-indented-syntax ]
Less [ http://lesscss.org ]- By default, a CSS-based application is created. Use SCSS if required:
ng new syncfusion-angular-app --style=scss- During project setup, when prompted for the Server-side rendering (SSR) option, choose the appropriate configuration.

- Select the required AI tool or ‘none’ if you do not need any AI tool.
- Navigate to your newly created application directory:
cd syncfusion-angular-appNote: In Angular 19 and below, it uses
app.component.ts,app.component.html,app.component.cssetc. In Angular 20+, the CLI generates a simpler structure withsrc/app/app.ts,app.html, andapp.css(no.component.suffixes).
Adding Syncfusion® Angular Pivot Table packages
To install the Pivot Table component, use the following command:
npm install @syncfusion/ej2-angular-pivotview --saveAdding CSS reference
The following CSS files are available in the ../node_modules/@syncfusion package folder. Add these as references in src/styles.css
@import '../node_modules/@syncfusion/ej2-base/styles/tailwind3.css';
@import '../node_modules/@syncfusion/ej2-buttons/styles/tailwind3.css';
@import '../node_modules/@syncfusion/ej2-dropdowns/styles/tailwind3.css';
@import '../node_modules/@syncfusion/ej2-grids/styles/tailwind3.css';
@import '../node_modules/@syncfusion/ej2-inputs/styles/tailwind3.css';
@import '../node_modules/@syncfusion/ej2-lists/styles/tailwind3.css';
@import '../node_modules/@syncfusion/ej2-navigations/styles/tailwind3.css';
@import '../node_modules/@syncfusion/ej2-popups/styles/tailwind3.css';
@import '../node_modules/@syncfusion/ej2-splitbuttons/styles/tailwind3.css';
@import '../node_modules/@syncfusion/ej2-angular-pivotview/styles/tailwind3.css';
Ensure that the import order aligns with the component’s dependency sequence.
For using SCSS styles, refer to this guide.
Add Pivot Table component
Modify the template in the src/app/app.ts file to render the Pivot Table component. Add the Angular Pivot Table by using <ejs-pivotview> selector in template section of the app.ts file.
import { PivotViewModule } from '@syncfusion/ej2-angular-pivotview';
import { Component, OnInit } from '@angular/core';
import { IDataSet } from '@syncfusion/ej2-angular-pivotview';
import { DataSourceSettingsModel } from '@syncfusion/ej2-pivotview/src/model/datasourcesettings-model';

@Component({
  imports: [
    PivotViewModule
  ],
  standalone: true,
  selector: 'app-root',
  template: `<div style="height: 480px;"><ejs-pivotview #pivotview id='PivotView' height='350' [dataSourceSettings]=dataSourceSettings [width]=width></ejs-pivotview></div>`
})

export class App implements OnInit {
  public dataSourceSettings?: DataSourceSettingsModel;
  public width?: string;
  public Pivot_Data: IDataSet[] = [
    { 'Sold': 31, 'Amount': 52824, 'Country': 'France', 'Products': 'Mountain Bikes', 'Year': 'FY 2025', 'Quarter': 'Q1' },
    { 'Sold': 51, 'Amount': 86904, 'Country': 'France', 'Products': 'Mountain Bikes', 'Year': 'FY 2025', 'Quarter': 'Q2' },
    { 'Sold': 90, 'Amount': 153360, 'Country': 'France', 'Products': 'Mountain Bikes', 'Year': 'FY 2025', 'Quarter': 'Q3' },
    { 'Sold': 25, 'Amount': 42600, 'Country': 'France', 'Products': 'Mountain Bikes', 'Year': 'FY 2025', 'Quarter': 'Q4' }
  ];
  ngOnInit(): void {
    this.dataSourceSettings = {
      dataSource: this.Pivot_Data as IDataSet[],
      columns: [{ name: 'Year' }, { name: 'Quarter' }],
      expandAll: true,
      formatSettings: [{ name: 'Amount', format: 'C0' }],
      rows: [{ name: 'Country' }, { name: 'Products' }],
      values: [{ name: 'Amount', caption: 'Sold Amount' }, { name: 'Sold', caption: 'Units Sold' }]
    };
    this.width = "100%";
  }
}
@import '../node_modules/@syncfusion/ej2-base/styles/tailwind3.css';
@import '../node_modules/@syncfusion/ej2-buttons/styles/tailwind3.css';
@import '../node_modules/@syncfusion/ej2-dropdowns/styles/tailwind3.css';
@import '../node_modules/@syncfusion/ej2-grids/styles/tailwind3.css';
@import '../node_modules/@syncfusion/ej2-inputs/styles/tailwind3.css';
@import '../node_modules/@syncfusion/ej2-lists/styles/tailwind3.css';
@import '../node_modules/@syncfusion/ej2-navigations/styles/tailwind3.css';
@import '../node_modules/@syncfusion/ej2-popups/styles/tailwind3.css';
@import '../node_modules/@syncfusion/ej2-splitbuttons/styles/tailwind3.css';
@import '../node_modules/@syncfusion/ej2-angular-pivotview/styles/tailwind3.css';import { bootstrapApplication } from '@angular/platform-browser';
import { appConfig } from './app/app.config';
import { App } from './app/app';
bootstrapApplication(App, appConfig)
.catch((err) => console.error(err));NOTE
If you move the Pivot Table component template code into src/app/app.html, ensure to clear all auto-generated markup and styles from the file before moving. This prevents layout conflicts and helps ensure that Syncfusion components render correctly.
Run the application
ng serve --openYou can also explore our Angular Pivot Table example to see an interactive sample with drill-up and drill-down options, and API documentation for more properties and methods.