Title and Subtitle in Angular Chart Component
13 Mar 202624 minutes to read
Chart titles and subtitles help provide context for the visualized data. The title typically indicates the main subject or metric represented in the chart, while the subtitle adds supporting details such as data sources, time ranges, or explanatory notes. Both elements can be customized in terms of position, alignment, and style to align with application design requirements.
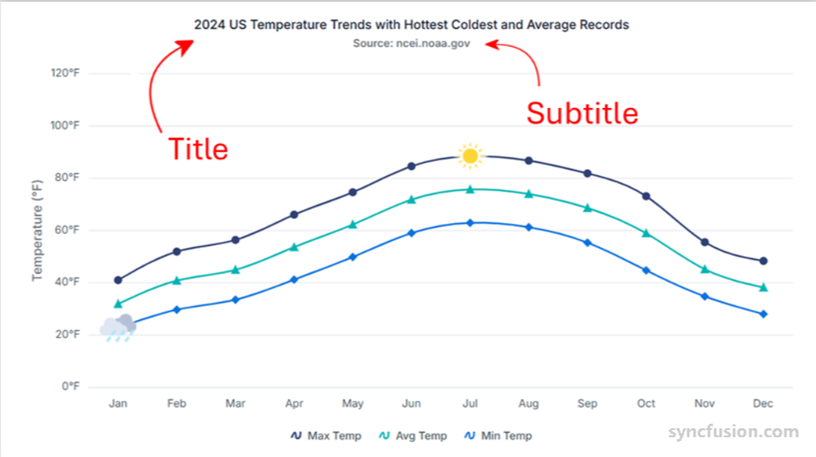
Chart title
Add a chart title using the title property. The title appears at the top of the chart by default and is used to describe the purpose or subject of the visualization.
import { ChartModule } from '@syncfusion/ej2-angular-charts'
import { DateTimeService, StepLineSeriesService, LegendService, CategoryService, LineSeriesService } from '@syncfusion/ej2-angular-charts'
import { TooltipService } from '@syncfusion/ej2-angular-charts'
import { Component, OnInit } from '@angular/core';

@Component({
imports: [
         ChartModule
    ],

providers: [ TooltipService, DateTimeService, StepLineSeriesService, LegendService, CategoryService, LineSeriesService],
standalone: true,
    selector: 'app-container',
    template: `<ejs-chart id="chart-container" [primaryXAxis]='primaryXAxis'[primaryYAxis]='primaryYAxis' [title]='title' [titleStyle]='titleStyle'>
        <e-series-collection>
            <e-series [dataSource]='chartData' type='StepLine' xName='x' yName='y' width=2 name='China' [marker]='marker'></e-series>
            <e-series [dataSource]='chartData' type='StepLine' xName='x' yName='y1' width=2 name='Australia' [marker]='marker'></e-series>
            <e-series [dataSource]='chartData' type='StepLine' xName='x' yName='y2' width=2 name='Japan' [marker]='marker'></e-series>
        </e-series-collection>
    </ejs-chart>`
})
export class AppComponent implements OnInit {
    public primaryXAxis?: Object;
    public chartData?: Object[];
    public title?: string;
    public primaryYAxis?: Object;
    public marker?: Object;
    public titleStyle?: Object;
    ngOnInit(): void {
        this.chartData = [
                { x: new Date(1975, 0, 1), y: 16, y1: 10, y2: 4.5 },
                { x: new Date(1980, 0, 1), y: 12.5, y1: 7.5, y2: 5 },
                { x: new Date(1985, 0, 1), y: 19, y1: 11, y2: 6.5 },
                { x: new Date(1990, 0, 1), y: 14.4, y1: 7, y2: 4.4 },
                { x: new Date(1995, 0, 1), y: 11.5, y1: 8, y2: 5 },
                { x: new Date(2000, 0, 1), y: 14, y1: 6, y2: 1.5 },
                { x: new Date(2005, 0, 1), y: 10, y1: 3.5, y2: 2.5 },
                { x: new Date(2010, 0, 1), y: 16, y1: 7, y2: 3.7 }
        ];
        this.primaryXAxis = {
            title: 'Years',
            lineStyle: { width: 0 },
            labelFormat: 'y',
            intervalType: 'Years',
            valueType: 'DateTime',
            edgeLabelPlacement: 'Shift'
        };
        this.primaryYAxis = {
            title: 'Percentage (%)',
            minimum: 0, maximum: 20, interval: 2,
            labelFormat: '{value}%'
        };
        this.marker = { visible: true, width: 10, height: 10 };
        this.title = 'Unemployment Rates 1975-2010';
        this.titleStyle = {
            fontFamily: "Arial",
            fontStyle: 'italic',
            fontWeight: 'regular',
            color: "#E27F2D",
            size: '23px'
        }
    }

}
import { bootstrapApplication } from '@angular/platform-browser';
import { AppComponent } from './app.component';
import 'zone.js';
bootstrapApplication(AppComponent).catch((err) => console.error(err));Title position
Use the position property within titleStyle to place the title at the left, right, top, or bottom of the chart. The default position is at the top.
import { ChartModule } from '@syncfusion/ej2-angular-charts'
import { DateTimeService, StepLineSeriesService, LegendService, CategoryService, LineSeriesService } from '@syncfusion/ej2-angular-charts'
import { TooltipService } from '@syncfusion/ej2-angular-charts'
import { Component, OnInit } from '@angular/core';

@Component({
imports: [
         ChartModule
    ],

providers: [ TooltipService, DateTimeService, StepLineSeriesService, LegendService, CategoryService, LineSeriesService],
standalone: true,
    selector: 'app-container',
    template: `<ejs-chart id="chart-container" [primaryXAxis]='primaryXAxis'[primaryYAxis]='primaryYAxis' [title]='title' [titleStyle]='titleStyle'>
        <e-series-collection>
            <e-series [dataSource]='chartData' type='StepLine' xName='x' yName='y' width=2 name='China' [marker]='marker'></e-series>
            <e-series [dataSource]='chartData' type='StepLine' xName='x' yName='y1' width=2 name='Australia' [marker]='marker'></e-series>
            <e-series [dataSource]='chartData' type='StepLine' xName='x' yName='y2' width=2 name='Japan' [marker]='marker'></e-series>
        </e-series-collection>
    </ejs-chart>`
})
export class AppComponent implements OnInit {
    public primaryXAxis?: Object;
    public chartData?: Object[];
    public title?: string;
    public primaryYAxis?: Object;
    public marker?: Object;
    public titleStyle?: Object;
    ngOnInit(): void {
        this.chartData = [
            { x: new Date(1975, 0, 1), y: 16, y1: 10, y2: 4.5 },
            { x: new Date(1980, 0, 1), y: 12.5, y1: 7.5, y2: 5 },
            { x: new Date(1985, 0, 1), y: 19, y1: 11, y2: 6.5 },
            { x: new Date(1990, 0, 1), y: 14.4, y1: 7, y2: 4.4 },
            { x: new Date(1995, 0, 1), y: 11.5, y1: 8, y2: 5 },
            { x: new Date(2000, 0, 1), y: 14, y1: 6, y2: 1.5 },
            { x: new Date(2005, 0, 1), y: 10, y1: 3.5, y2: 2.5 },
            { x: new Date(2010, 0, 1), y: 16, y1: 7, y2: 3.7 }
        ];
        this.primaryXAxis = {
            title: 'Years',
            lineStyle: { width: 0 },
            labelFormat: 'y',
            intervalType: 'Years',
            valueType: 'DateTime',
            edgeLabelPlacement: 'Shift'
        };
        this.primaryYAxis = {
            title: 'Percentage (%)',
            minimum: 0, maximum: 20, interval: 2,
            labelFormat: '{value}%'
        };
        this.marker = { visible: true, width: 10, height: 10 };
        this.title = 'Unemployment Rates 1975-2010';
        this.titleStyle = {
            position: 'Bottom'
        }
    }

}
import { bootstrapApplication } from '@angular/platform-browser';
import { AppComponent } from './app.component';
import 'zone.js';
bootstrapApplication(AppComponent).catch((err) => console.error(err));To manually position the title anywhere within the chart, use the x and y properties.
import { ChartModule } from '@syncfusion/ej2-angular-charts'
import { DateTimeService, StepLineSeriesService, LegendService, CategoryService, LineSeriesService } from '@syncfusion/ej2-angular-charts'
import { TooltipService } from '@syncfusion/ej2-angular-charts'
import { Component, OnInit } from '@angular/core';

@Component({
imports: [
         ChartModule
    ],

providers: [ TooltipService, DateTimeService, StepLineSeriesService, LegendService, CategoryService, LineSeriesService],
standalone: true,
    selector: 'app-container',
    template: `<ejs-chart id="chart-container" [primaryXAxis]='primaryXAxis'[primaryYAxis]='primaryYAxis' [title]='title' [titleStyle]='titleStyle'>
        <e-series-collection>
            <e-series [dataSource]='chartData' type='StepLine' xName='x' yName='y' width=2 name='China' [marker]='marker'></e-series>
            <e-series [dataSource]='chartData' type='StepLine' xName='x' yName='y1' width=2 name='Australia' [marker]='marker'></e-series>
            <e-series [dataSource]='chartData' type='StepLine' xName='x' yName='y2' width=2 name='Japan' [marker]='marker'></e-series>
        </e-series-collection>
    </ejs-chart>`
})
export class AppComponent implements OnInit {
    public primaryXAxis?: Object;
    public chartData?: Object[];
    public title?: string;
    public primaryYAxis?: Object;
    public marker?: Object;
    public titleStyle?: Object;
    ngOnInit(): void {
        this.chartData = [
            { x: new Date(1975, 0, 1), y: 16, y1: 10, y2: 4.5 },
            { x: new Date(1980, 0, 1), y: 12.5, y1: 7.5, y2: 5 },
            { x: new Date(1985, 0, 1), y: 19, y1: 11, y2: 6.5 },
            { x: new Date(1990, 0, 1), y: 14.4, y1: 7, y2: 4.4 },
            { x: new Date(1995, 0, 1), y: 11.5, y1: 8, y2: 5 },
            { x: new Date(2000, 0, 1), y: 14, y1: 6, y2: 1.5 },
            { x: new Date(2005, 0, 1), y: 10, y1: 3.5, y2: 2.5 },
            { x: new Date(2010, 0, 1), y: 16, y1: 7, y2: 3.7 }
        ];
        this.primaryXAxis = {
            title: 'Years',
            lineStyle: { width: 0 },
            labelFormat: 'y',
            intervalType: 'Years',
            valueType: 'DateTime',
            edgeLabelPlacement: 'Shift'
        };
        this.primaryYAxis = {
            title: 'Percentage (%)',
            minimum: 0, maximum: 20, interval: 2,
            labelFormat: '{value}%'
        };
        this.marker = { visible: true, width: 10, height: 10 };
        this.title = 'Unemployment Rates 1975-2010';
        this.titleStyle = {
            position: 'Custom',
            location: { x: 200, y: 20 }
        }
    }

}
import { bootstrapApplication } from '@angular/platform-browser';
import { AppComponent } from './app.component';
import 'zone.js';
bootstrapApplication(AppComponent).catch((err) => console.error(err));Title alignment
Align the chart title to the near, center, or far side of the chart using the textAlignment property.
import { ChartModule } from '@syncfusion/ej2-angular-charts'
import { DateTimeService, StepLineSeriesService, LegendService, CategoryService, LineSeriesService } from '@syncfusion/ej2-angular-charts'
import { TooltipService } from '@syncfusion/ej2-angular-charts'
import { Component, OnInit } from '@angular/core';

@Component({
imports: [
         ChartModule
    ],

providers: [ TooltipService, DateTimeService, StepLineSeriesService, LegendService, CategoryService, LineSeriesService],
standalone: true,
    selector: 'app-container',
    template: `<ejs-chart id="chart-container" [primaryXAxis]='primaryXAxis'[primaryYAxis]='primaryYAxis' [title]='title' [titleStyle]='titleStyle'>
        <e-series-collection>
            <e-series [dataSource]='chartData' type='StepLine' xName='x' yName='y' width=2 name='China' [marker]='marker'></e-series>
            <e-series [dataSource]='chartData' type='StepLine' xName='x' yName='y1' width=2 name='Australia' [marker]='marker'></e-series>
            <e-series [dataSource]='chartData' type='StepLine' xName='x' yName='y2' width=2 name='Japan' [marker]='marker'></e-series>
        </e-series-collection>
    </ejs-chart>`
})
export class AppComponent implements OnInit {
    public primaryXAxis?: Object;
    public chartData?: Object[];
    public title?: string;
    public primaryYAxis?: Object;
    public marker?: Object;
    public titleStyle?: Object;
    ngOnInit(): void {
        this.chartData = [
            { x: new Date(1975, 0, 1), y: 16, y1: 10, y2: 4.5 },
            { x: new Date(1980, 0, 1), y: 12.5, y1: 7.5, y2: 5 },
            { x: new Date(1985, 0, 1), y: 19, y1: 11, y2: 6.5 },
            { x: new Date(1990, 0, 1), y: 14.4, y1: 7, y2: 4.4 },
            { x: new Date(1995, 0, 1), y: 11.5, y1: 8, y2: 5 },
            { x: new Date(2000, 0, 1), y: 14, y1: 6, y2: 1.5 },
            { x: new Date(2005, 0, 1), y: 10, y1: 3.5, y2: 2.5 },
            { x: new Date(2010, 0, 1), y: 16, y1: 7, y2: 3.7 }
        ];
        this.primaryXAxis = {
            title: 'Years',
            lineStyle: { width: 0 },
            labelFormat: 'y',
            intervalType: 'Years',
            valueType: 'DateTime',
            edgeLabelPlacement: 'Shift'
        };
        this.primaryYAxis = {
            title: 'Percentage (%)',
            minimum: 0, maximum: 20, interval: 2,
            labelFormat: '{value}%'
        };
        this.marker = { visible: true, width: 10, height: 10 };
        this.title = 'Unemployment Rates 1975-2010';
        this.titleStyle = {
            position: 'Bottom',
            textAlignment: 'Far'
        }
    }

}
import { bootstrapApplication } from '@angular/platform-browser';
import { AppComponent } from './app.component';
import 'zone.js';
bootstrapApplication(AppComponent).catch((err) => console.error(err));Title styling
Customize the title’s appearance using the titleStyle property. Options include size, color, fontFamily, fontWeight, fontStyle, opacity, textAlignment, and textOverflow to control how the title is rendered within the chart area. The textOverflow: 'Wrap' option enables wrapping when the title width exceeds available space.
import { ChartModule } from '@syncfusion/ej2-angular-charts'
import { DateTimeService, StepLineSeriesService, LegendService, CategoryService, LineSeriesService } from '@syncfusion/ej2-angular-charts'
import { TooltipService } from '@syncfusion/ej2-angular-charts'
import { Component, OnInit } from '@angular/core';

@Component({
imports: [
         ChartModule
    ],

providers: [ TooltipService, DateTimeService, StepLineSeriesService, LegendService, CategoryService, LineSeriesService],
standalone: true,
    selector: 'app-container',
    template: `<ejs-chart id="chart-container" [primaryXAxis]='primaryXAxis'[primaryYAxis]='primaryYAxis' [title]='title' [titleStyle]='titleStyle'>
        <e-series-collection>
            <e-series [dataSource]='chartData' type='Line' xName='month' yName='sales' width=2 name='China' [marker]='marker'></e-series>
        </e-series-collection>
    </ejs-chart>`
})
export class AppComponent implements OnInit {
    public primaryXAxis?: Object;
    public chartData?: Object[];
    public title?: string;
    public marker?: Object;
    public titleStyle?: Object;
    primaryYAxis: any;
    ngOnInit(): void {
        this.chartData =  [
      { month: 'Jan', sales: 35 }, { month: 'Feb', sales: 28 },
      { month: 'Mar', sales: 34 }, { month: 'Apr', sales: 32 },
      { month: 'May', sales: 40 }, { month: 'Jun', sales: 32 },
      { month: 'Jul', sales: 35 }, { month: 'Aug', sales: 55 },
      { month: 'Sep', sales: 38 }, { month: 'Oct', sales: 30 },
      { month: 'Nov', sales: 25 }, { month: 'Dec', sales: 32 }
];
        this.primaryXAxis = {
            valueType: 'Category',
        };
        this.marker = { visible: true, width: 10, height: 10 };
        this.title = 'Unemployment Rates 1975-2010';
        this.titleStyle = {
           size:'18px', color:'Red', textAlignment: 'Far', textOverflow: 'Wrap'
        }
    }

}
import { bootstrapApplication } from '@angular/platform-browser';
import { AppComponent } from './app.component';
import 'zone.js';
bootstrapApplication(AppComponent).catch((err) => console.error(err));Chart subTitle
Add a subtitle to the chart using the subTitle property. Subtitles help provide additional context such as descriptions, notes, or supporting information related to the chart data.
import { ChartModule } from '@syncfusion/ej2-angular-charts'
import { DateTimeService, StepLineSeriesService, LegendService, CategoryService, LineSeriesService } from '@syncfusion/ej2-angular-charts'
import { TooltipService } from '@syncfusion/ej2-angular-charts'
import { Component, OnInit } from '@angular/core';

@Component({
imports: [
         ChartModule
    ],

providers: [ TooltipService, DateTimeService, StepLineSeriesService, LegendService, CategoryService, LineSeriesService],
standalone: true,
    selector: 'app-container',
    template: `<ejs-chart id="chart-container" [primaryXAxis]='primaryXAxis'[primaryYAxis]='primaryYAxis' [title]='title' [subTitle]='subTitle' [subTitleStyle]='subTitleStyle'>
        <e-series-collection>
            <e-series [dataSource]='chartData' type='StepLine' xName='x' yName='y' width=2 name='China' [marker]='marker'></e-series>
            <e-series [dataSource]='chartData' type='StepLine' xName='x' yName='y1' width=2 name='Australia' [marker]='marker'></e-series>
            <e-series [dataSource]='chartData' type='StepLine' xName='x' yName='y2' width=2 name='Japan' [marker]='marker'></e-series>
        </e-series-collection>
    </ejs-chart>`
})
export class AppComponent implements OnInit {
    public primaryXAxis?: Object;
    public chartData?: Object[];
    public title?: string;
    public subTitle?: string;
    public primaryYAxis?: Object;
    public marker?: Object;
    public subTitleStyle?: Object;
    ngOnInit(): void {
        this.chartData = [
                { x: new Date(1975, 0, 1), y: 16, y1: 10, y2: 4.5 },
                { x: new Date(1980, 0, 1), y: 12.5, y1: 7.5, y2: 5 },
                { x: new Date(1985, 0, 1), y: 19, y1: 11, y2: 6.5 },
                { x: new Date(1990, 0, 1), y: 14.4, y1: 7, y2: 4.4 },
                { x: new Date(1995, 0, 1), y: 11.5, y1: 8, y2: 5 },
                { x: new Date(2000, 0, 1), y: 14, y1: 6, y2: 1.5 },
                { x: new Date(2005, 0, 1), y: 10, y1: 3.5, y2: 2.5 },
                { x: new Date(2010, 0, 1), y: 16, y1: 7, y2: 3.7 }
        ];
        this.primaryXAxis = {
            title: 'Years',
            lineStyle: { width: 0 },
            labelFormat: 'y',
            intervalType: 'Years',
            valueType: 'DateTime',
            edgeLabelPlacement: 'Shift'
        };
        this.primaryYAxis = {
            title: 'Percentage (%)',
            minimum: 0, maximum: 20, interval: 2,
            labelFormat: '{value}%'
        };
        this.marker = { visible: true, width: 10, height: 10 };
        this.title = 'Unemployment Rates 1975-2010';
        this.subTitle = '(1975-2010)';
        this.subTitleStyle = {
            fontFamily: "Arial",
            fontStyle: 'italic',
            fontWeight: 'regular',
            color: "#E27F2D",
            size: '20px'
        }
    }

}
import { bootstrapApplication } from '@angular/platform-browser';
import { AppComponent } from './app.component';
import 'zone.js';
bootstrapApplication(AppComponent).catch((err) => console.error(err));