Selection in Angular Chart
31 Aug 202624 minutes to read
The chart provides selection support for both series and individual data points when users interact with the chart using mouse clicks.
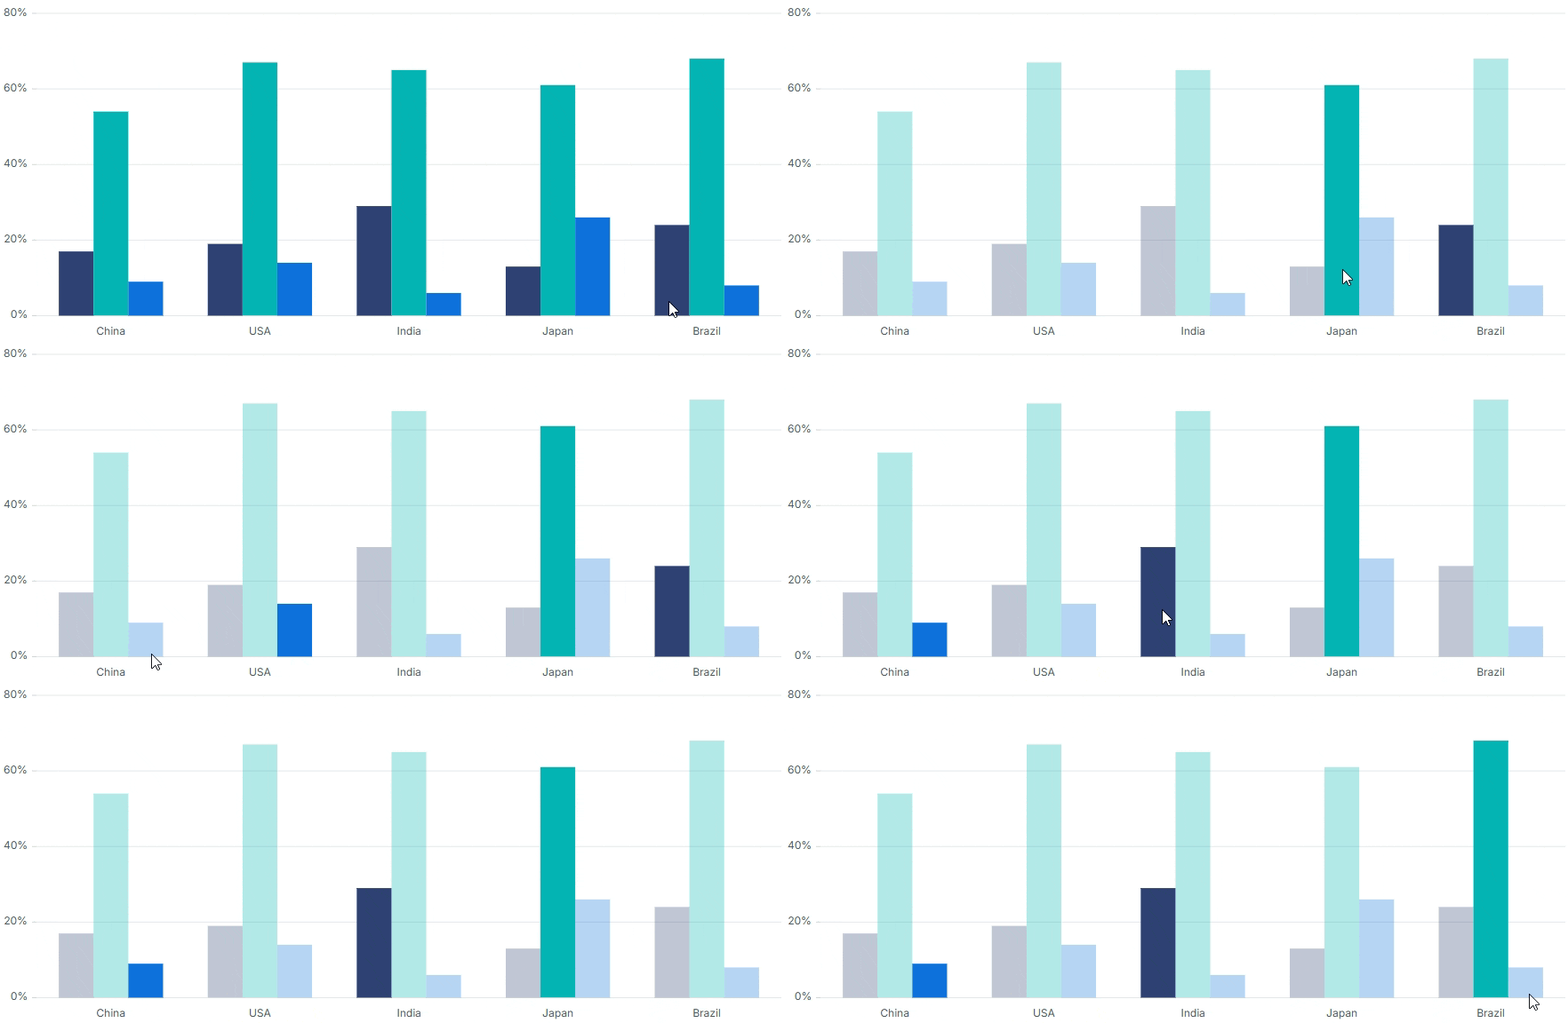
Note: When the mouse is clicked on the data points, the corresponding series legend will also be selected.
Note: To use the selection feature, inject
SelectionServiceintoNgModule.providers(or add it to the componentprovidersarray for standalone components).
The chart supports the following selection modes:
- None
- Point
- Series
- Cluster
- DragXY
- DragX
- DragY
- Lasso
Point
You can select a point by setting selectionMode to Point.
import { ChartModule } from '@syncfusion/ej2-angular-charts'
import { CategoryService, ColumnSeriesService } from '@syncfusion/ej2-angular-charts'
import { LegendService, SelectionService } from '@syncfusion/ej2-angular-charts'
import { Component, OnInit } from '@angular/core';
import { selectionData } from './datasource';
@Component({
imports: [
         ChartModule
    ],

providers: [ CategoryService, ColumnSeriesService, LegendService, SelectionService],
standalone: true,
    selector: 'app-container',
    template: `<ejs-chart id="chart-container" [primaryXAxis]='primaryXAxis' [primaryYAxis]='primaryYAxis' [title]='title' selectionMode='Point'>
        <e-series-collection>
            <e-series [dataSource]='chartData' type='Column' xName='country' yName='gold' name='Gold' ></e-series>
            <e-series [dataSource]='chartData' type='Column' xName='country' yName='silver' name='Silver'></e-series>
            <e-series [dataSource]='chartData' type='Column' xName='country' yName='bronze' name='Bronze' ></e-series>
        </e-series-collection>
    </ejs-chart>`
})
export class AppComponent implements OnInit {
    public primaryXAxis?: Object;
    public primaryYAxis?: Object;
    public chartData?: Object[];
    public title?: string;
    ngOnInit(): void {
        this.chartData = selectionData;
        this.primaryXAxis = {
           valueType: 'Category',
           title: 'Countries'
        };
        this.primaryYAxis = {
           title: 'Medals'
        };
        this.title = 'Olympic Medals';
    }

}#loader {
color: #008cff;
font-family: 'Helvetica Neue','calibiri';
font-size:16px;
height: 40px;
left: 45%;
position: absolute;
top: 45%;
width: 30%;
}
.animation {
background: #333333;
border: 1px solid #cecece;
box-sizing: border-box;
height: 100px;
width: 100px;
}
#chart-container {
display: block;
height: 350px;
}
.chartSelection1 {
fill:red;
}
.chartSelection2 {
fill: green;
}
.chartSelection3 {
fill: blue;
}Series
You can select a series by setting selectionMode to Series.
import { ChartModule } from '@syncfusion/ej2-angular-charts'
import { CategoryService, ColumnSeriesService } from '@syncfusion/ej2-angular-charts'
import { LegendService, SelectionService } from '@syncfusion/ej2-angular-charts'
import { Component, OnInit } from '@angular/core';
import { selectionData } from './datasource';

@Component({
imports: [
         ChartModule
    ],

providers: [ CategoryService, ColumnSeriesService, LegendService, SelectionService],
standalone: true,
    selector: 'app-container',
    template: `<ejs-chart id="chart-container" [primaryXAxis]='primaryXAxis' [primaryYAxis]='primaryYAxis' [title]='title' selectionMode='Series'>
        <e-series-collection>
            <e-series [dataSource]='chartData' type='Column' xName='country' yName='gold' name='Gold' ></e-series>
            <e-series [dataSource]='chartData' type='Column' xName='country' yName='silver' name='Silver'></e-series>
            <e-series [dataSource]='chartData' type='Column' xName='country' yName='bronze' name='Bronze' ></e-series>
        </e-series-collection>
    </ejs-chart>`
})
export class AppComponent implements OnInit {
    public primaryXAxis?: Object;
    public chartData?: Object[];
    public title?: string;
    public primaryYAxis?: Object;
    ngOnInit(): void {
        this.chartData = selectionData;
        this.primaryXAxis = {
           valueType: 'Category',
           title: 'Countries'
        };
        this.primaryYAxis = {
           title: 'Medals'
        };
        this.title = 'Olympic Medals';
    }

}#loader {
color: #008cff;
font-family: 'Helvetica Neue','calibiri';
font-size:16px;
height: 40px;
left: 45%;
position: absolute;
top: 45%;
width: 30%;
}
.animation {
background: #333333;
border: 1px solid #cecece;
box-sizing: border-box;
height: 100px;
width: 100px;
}
#chart-container {
display: block;
height: 350px;
}
.chartSelection1 {
fill:red;
}
.chartSelection2 {
fill: green;
}
.chartSelection3 {
fill: blue;
}Cluster
You can select the points that correspond to the same index in all the series by setting selectionMode to Cluster.
import { ChartModule } from '@syncfusion/ej2-angular-charts'
import { CategoryService, ColumnSeriesService } from '@syncfusion/ej2-angular-charts'
import { LegendService, SelectionService } from '@syncfusion/ej2-angular-charts'
import { Component, OnInit } from '@angular/core';
import { selectionData } from './datasource';
@Component({
imports: [
         ChartModule
    ],

providers: [ CategoryService, ColumnSeriesService, LegendService, SelectionService],
standalone: true,
    selector: 'app-container',
    template: `<ejs-chart id="chart-container" [primaryXAxis]='primaryXAxis' [primaryYAxis]='primaryYAxis' [title]='title' selectionMode='Cluster'>
        <e-series-collection>
            <e-series [dataSource]='chartData' type='Column' xName='country' yName='gold' name='Gold' ></e-series>
            <e-series [dataSource]='chartData' type='Column' xName='country' yName='silver' name='Silver'></e-series>
            <e-series [dataSource]='chartData' type='Column' xName='country' yName='bronze' name='Bronze' ></e-series>
        </e-series-collection>
    </ejs-chart>`
})
export class AppComponent implements OnInit {
    public primaryXAxis?: Object;
    public chartData?: Object[];
    public title?: string;
    public primaryYAxis?: Object;
    ngOnInit(): void {
        this.chartData = selectionData;
        this.primaryXAxis = {
           valueType: 'Category',
           title: 'Countries'
        };
        this.primaryYAxis = {
           title: 'Medals'
        };
        this.title = 'Olympic Medals';
    }

}#loader {
color: #008cff;
font-family: 'Helvetica Neue','calibiri';
font-size:16px;
height: 40px;
left: 45%;
position: absolute;
top: 45%;
width: 30%;
}
.animation {
background: #333333;
border: 1px solid #cecece;
box-sizing: border-box;
height: 100px;
width: 100px;
}
#chart-container {
display: block;
height: 350px;
}
.chartSelection1 {
fill:red;
}
.chartSelection2 {
fill: green;
}
.chartSelection3 {
fill: blue;
}Rectangular selection
DragXY, DragX and DragY
To fetch the collection of data under a particular region, set selectionMode to DragXY. These modes require Cartesian (XY-value) series.
- DragXY - Allows data to be selected with respect to both the horizontal and vertical axes.
- DragX - Allows data to be selected with respect to the horizontal axis.
- DragY - Allows data to be selected with respect to the vertical axis.
The selected data is returned as an array collection in the dragComplete event.
import { ChartModule } from '@syncfusion/ej2-angular-charts'
import { ScatterSeriesService, LegendService, SelectionService } from '@syncfusion/ej2-angular-charts'
import { Component, OnInit } from '@angular/core';
import { ChartData } from './chartdata.service';

@Component({
imports: [
         ChartModule
    ],

providers: [ ScatterSeriesService, LegendService, SelectionService],
standalone: true,
    selector: 'app-container',
    template: `<ejs-chart id="chart-container" [primaryXAxis]='primaryXAxis'[primaryYAxis]='primaryYAxis' [title]='title' selectionMode='DragXY'>
        <e-series-collection>
            <e-series [dataSource]='series1' type='Scatter' xName='x' yName='y' name='Male' opacity=0.7 [marker]='marker'></e-series>
            <e-series [dataSource]='series2' type='Scatter' xName='x' yName='y' name='Female' opacity=0.7 [marker]='marker'></e-series>
        </e-series-collection>
    </ejs-chart>`
})
export class AppComponent implements OnInit {
    public primaryXAxis?: Object;
    public chartData?: Object[];
    public title?: string;
    public primaryYAxis?: Object;
    public series1?: Object;
    public series2?: Object;
    public marker?: Object;
    ngOnInit(): void {
        this.primaryXAxis = {
            title: 'Height (cm)',
            minimum: 120, maximum: 180,
            edgeLabelPlacement: 'Shift',
            labelFormat: '{value}cm'
        };
        this.primaryYAxis = {
            title: 'Weight (kg)',
            minimum: 60, maximum: 90,
            labelFormat: '{value}kg',
            rangePadding: 'None'
        };
        this.title = 'Height Vs Weight';
        this.marker = {  width: 10, height: 10 };
        this.series1 = ChartData.prototype.getScatterData().series1;
        this.series2 = ChartData.prototype.getScatterData().series2;
    }

}#loader {
color: #008cff;
font-family: 'Helvetica Neue','calibiri';
font-size:16px;
height: 40px;
left: 45%;
position: absolute;
top: 45%;
width: 30%;
}
.animation {
background: #333333;
border: 1px solid #cecece;
box-sizing: border-box;
height: 100px;
width: 100px;
}
#chart-container {
display: block;
height: 350px;
}Lasso selection
To select a region by drawing freehand shapes to fetch a collection of data, set selectionMode to Lasso. You can also select multiple regions on the chart through this mode.
import { ChartModule } from '@syncfusion/ej2-angular-charts'
import { ScatterSeriesService, LegendService, SelectionService } from '@syncfusion/ej2-angular-charts'
import { Component, OnInit } from '@angular/core';
import { ChartData } from './chartdata.service';

@Component({
imports: [
         ChartModule
    ],

providers: [ ScatterSeriesService, LegendService, SelectionService],
standalone: true,
    selector: 'app-container',
    template: `<ejs-chart id="chart-container" [primaryXAxis]='primaryXAxis'[primaryYAxis]='primaryYAxis' [title]='title' selectionMode='Lasso'>
        <e-series-collection>
            <e-series [dataSource]='series1' type='Scatter' xName='x' yName='y' name='Male' opacity=0.7 [marker]='marker'></e-series>
            <e-series [dataSource]='series2' type='Scatter' xName='x' yName='y' name='Female' opacity=0.7 [marker]='marker'></e-series>
        </e-series-collection>
    </ejs-chart>`
})
export class AppComponent implements OnInit {
    public primaryXAxis?: Object;
    public chartData?: Object[];
    public title?: string;
    public primaryYAxis?: Object;
    public series1?: Object;
    public series2?: Object;
    public marker?: Object;
    ngOnInit(): void {
        this.primaryXAxis = {
            title: 'Height (cm)',
            minimum: 120, maximum: 180,
            edgeLabelPlacement: 'Shift',
            labelFormat: '{value}cm'
        };
        this.primaryYAxis = {
            title: 'Weight (kg)',
            minimum: 60, maximum: 90,
            labelFormat: '{value}kg',
            rangePadding: 'None'
        };
        this.title = 'Height Vs Weight';
        this.marker = {  width: 10, height: 10 };
        this.series1 = ChartData.prototype.getScatterData().series1;
        this.series2 = ChartData.prototype.getScatterData().series2;
    }

}#loader {
color: #008cff;
font-family: 'Helvetica Neue','calibiri';
font-size:16px;
height: 40px;
left: 45%;
position: absolute;
top: 45%;
width: 30%;
}
.animation {
background: #333333;
border: 1px solid #cecece;
box-sizing: border-box;
height: 100px;
width: 100px;
}
#chart-container {
display: block;
height: 350px;
}Multi-region selection
To select multiple regions on the chart with DragXY, DragX, DragY, or Lasso, set the allowMultiSelection property to true.
import { ChartModule } from '@syncfusion/ej2-angular-charts'
import { ScatterSeriesService, LegendService, SelectionService } from '@syncfusion/ej2-angular-charts'
import { Component, OnInit } from '@angular/core';
import { ChartData } from './chartdata.service';

@Component({
imports: [
         ChartModule
    ],

providers: [ ScatterSeriesService, LegendService, SelectionService],
standalone: true,
    selector: 'app-container',
    template: `<ejs-chart id="chart-container" [primaryXAxis]='primaryXAxis'[primaryYAxis]='primaryYAxis' [title]='title' selectionMode='DragXY' allowMultiSelection='true'>
        <e-series-collection>
            <e-series [dataSource]='series1' type='Scatter' xName='x' yName='y' name='Male' opacity=0.7 [marker]='marker'></e-series>
            <e-series [dataSource]='series2' type='Scatter' xName='x' yName='y' name='Female' opacity=0.7 [marker]='marker'></e-series>
        </e-series-collection>
    </ejs-chart>`
})
export class AppComponent implements OnInit {
    public primaryXAxis?: Object;
    public chartData?: Object[];
    public title?: string;
    public primaryYAxis?: Object;
    public series1?: Object;
    public series2?: Object;
    public marker?: Object;
    ngOnInit(): void {
        this.primaryXAxis = {
            title: 'Height (cm)',
            minimum: 120, maximum: 180,
            edgeLabelPlacement: 'Shift',
            labelFormat: '{value}cm'
        };
        this.primaryYAxis = {
            title: 'Weight (kg)',
            minimum: 60, maximum: 90,
            labelFormat: '{value}kg',
            rangePadding: 'None'
        };
        this.title = 'Height Vs Weight';
        this.marker = {  width: 10, height: 10 };
        this.series1 = ChartData.prototype.getScatterData().series1;
        this.series2 = ChartData.prototype.getScatterData().series2;
    }

}#loader {
color: #008cff;
font-family: 'Helvetica Neue','calibiri';
font-size:16px;
height: 40px;
left: 45%;
position: absolute;
top: 45%;
width: 30%;
}
.animation {
background: #333333;
border: 1px solid #cecece;
box-sizing: border-box;
height: 100px;
width: 100px;
}
#chart-container {
display: block;
height: 350px;
}Selection type
You can select multiple points or series by enabling the isMultiSelect property.
import { ChartModule } from '@syncfusion/ej2-angular-charts'
import { CategoryService, ColumnSeriesService } from '@syncfusion/ej2-angular-charts'
import { LegendService, SelectionService } from '@syncfusion/ej2-angular-charts'
import { Component, OnInit } from '@angular/core';
import { selectionData } from './datasource';
@Component({
imports: [
         ChartModule
    ],

providers: [ CategoryService, ColumnSeriesService, LegendService, SelectionService],
standalone: true,
    selector: 'app-container',
    template: `<ejs-chart id="chart-container" [primaryXAxis]='primaryXAxis' [primaryYAxis]='primaryYAxis' [title]='title' selectionMode='Point' isMultiSelect='true'>
        <e-series-collection>
            <e-series [dataSource]='chartData' type='Column' xName='country' yName='gold' name='Gold' ></e-series>
            <e-series [dataSource]='chartData' type='Column' xName='country' yName='silver' name='Silver'></e-series>
            <e-series [dataSource]='chartData' type='Column' xName='country' yName='bronze' name='Bronze' ></e-series>
        </e-series-collection>
    </ejs-chart>`
})
export class AppComponent implements OnInit {
    public primaryXAxis?: Object;
    public chartData?: Object[];
    public title?: string;
    public primaryYAxis?: Object;
    ngOnInit(): void {
        this.chartData = selectionData;
        this.primaryXAxis = {
           valueType: 'Category',
           title: 'Countries'
        };
        this.primaryYAxis = {
           title: 'Medals'
        };
        this.title = 'Olympic Medals';
    }

}#loader {
color: #008cff;
font-family: 'Helvetica Neue','calibiri';
font-size:16px;
height: 40px;
left: 45%;
position: absolute;
top: 45%;
width: 30%;
}
.animation {
background: #333333;
border: 1px solid #cecece;
box-sizing: border-box;
height: 100px;
width: 100px;
}
#chart-container {
display: block;
height: 350px;
}
.chartSelection1 {
fill:red;
}
.chartSelection2 {
fill: green;
}
.chartSelection3 {
fill: blue;
}Selection on load
You can select a point or series programmatically on a chart using the selectedDataIndexes property. The property accepts an array of objects with the following shape:
| Field | Type | Description |
|---|---|---|
| series | number |
Zero-based index of the series to select. |
| point | number |
Zero-based index of the point in the series. |
The selection is applied after the chart is rendered, so set this property in ngOnInit (or before the chart is rendered) for the selection to appear on initial load.
import { ChartModule } from '@syncfusion/ej2-angular-charts'
import { CategoryService, ColumnSeriesService } from '@syncfusion/ej2-angular-charts'
import { LegendService, SelectionService } from '@syncfusion/ej2-angular-charts'
import { Component, OnInit } from '@angular/core';
import { selectionData } from './datasource';
@Component({
imports: [
         ChartModule
    ],

providers: [ CategoryService, ColumnSeriesService, LegendService, SelectionService],
standalone: true,
    selector: 'app-container',
    template: `<ejs-chart id="chart-container" [primaryXAxis]='primaryXAxis' [primaryYAxis]='primaryYAxis' [title]='title'
            selectionMode='Point' [selectedDataIndexes]='selectedData'>
        <e-series-collection>
            <e-series [dataSource]='chartData' type='Column' xName='country' yName='gold' name='Gold'></e-series>
            <e-series [dataSource]='chartData' type='Column' xName='country' yName='silver' name='Silver'></e-series>
            <e-series [dataSource]='chartData' type='Column' xName='country' yName='bronze' name='Bronze'></e-series>
        </e-series-collection>
    </ejs-chart>`
})
export class AppComponent implements OnInit {
    public primaryXAxis?: Object;
    public chartData?: Object[];
    public title?: string;
    public primaryYAxis?: Object;
    public selectedData?: Object[];
    ngOnInit(): void {
        this.chartData = selectionData;
        this.primaryXAxis = {
           valueType: 'Category',
           title: 'Countries'
        };
        this.primaryYAxis = {
           title: 'Medals'
        };
        this.selectedData = [
            { series: 0, point: 1 }, { series: 2, point: 3 }
        ];
        this.title = 'Olympic Medals';
    }

}#loader {
color: #008cff;
font-family: 'Helvetica Neue','calibiri';
font-size:16px;
height: 40px;
left: 45%;
position: absolute;
top: 45%;
width: 30%;
}
.animation {
background: #333333;
border: 1px solid #cecece;
box-sizing: border-box;
height: 100px;
width: 100px;
}
#chart-container {
display: block;
height: 350px;
}
.chartSelection1 {
fill:red;
}
.chartSelection2 {
fill: green;
}
.chartSelection3 {
fill: blue;
}Customization for selection
You can apply a custom style to selected points or series with the selectionStyle property. The value is a CSS class name, so the corresponding class must be defined in your stylesheet. For example:
.chartSelection1 { fill: #1e90ff; }
.chartSelection2 { fill: #2ca02c; }
.chartSelection3 { fill: #d62728; }import { ChartModule } from '@syncfusion/ej2-angular-charts'
import { CategoryService, ColumnSeriesService } from '@syncfusion/ej2-angular-charts'
import { LegendService, SelectionService } from '@syncfusion/ej2-angular-charts'
import { Component, OnInit } from '@angular/core';
import { selectionData } from './datasource';
@Component({
imports: [
ChartModule
],
providers: [ CategoryService, ColumnSeriesService, LegendService, SelectionService],
standalone: true,
selector: 'app-container',
template: `<ejs-chart id="chart-container" [primaryXAxis]='primaryXAxis' [primaryYAxis]='primaryYAxis' [title]='title' selectionMode='Point'>
<e-series-collection>
<e-series [dataSource]='chartData' type='Column' xName='country' yName='gold' name='Gold' selectionStyle='chartSelection1'></e-series>
<e-series [dataSource]='chartData' type='Column' xName='country' yName='silver' name='Silver' selectionStyle='chartSelection2'></e-series>
<e-series [dataSource]='chartData' type='Column' xName='country' yName='bronze' name='Bronze' selectionStyle='chartSelection3'></e-series>
</e-series-collection>
</ejs-chart>`
})
export class AppComponent implements OnInit {
public primaryXAxis?: Object;
public chartData?: Object[];
public title?: string;
public primaryYAxis?: Object;
ngOnInit(): void {
this.chartData = selectionData;
this.primaryXAxis = {
valueType: 'Category',
title: 'Countries'
};
this.primaryYAxis = {
title: 'Medals'
};
this.title = 'Olympic Medals';
}
}#loader {
color: #008cff;
font-family: 'Helvetica Neue','calibiri';
font-size:16px;
height: 40px;
left: 45%;
position: absolute;
top: 45%;
width: 30%;
}
.animation {
background: #333333;
border: 1px solid #cecece;
box-sizing: border-box;
height: 100px;
width: 100px;
}
#chart-container {
display: block;
height: 350px;
}
.chartSelection1 {
fill:red;
}
.chartSelection2 {
fill: green;
}
.chartSelection3 {
fill: blue;
}Selection through legend
You can show or hide a series by clicking its legend item using the toggleVisibility property of legendSettings. To highlight the corresponding series when the user hovers over a legend item, use the enableHighlight property. Legend highlighting requires the HighlightService to be injected alongside SelectionService.
When
highlightModeis set toSeries,Cluster, orPoint, legend highlighting will still occur even whenenableHighlightis set tofalse. This is because thehighlightModetakes precedence, so hovering over legend items will trigger highlighting of the corresponding series regardless of the legendenableHighlightsetting.
import { ChartModule } from '@syncfusion/ej2-angular-charts'
import { CategoryService, ColumnSeriesService } from '@syncfusion/ej2-angular-charts'
import { LegendService, SelectionService } from '@syncfusion/ej2-angular-charts'
import { Component, OnInit } from '@angular/core';
import { selectionData } from './datasource';
@Component({
imports: [
         ChartModule
    ],

providers: [ CategoryService, ColumnSeriesService, LegendService, SelectionService],
standalone: true,
    selector: 'app-container',
    template: `<ejs-chart id="chart-container" [primaryXAxis]='primaryXAxis' [primaryYAxis]='primaryYAxis' [title]='title'
       [legendSettings]='legendSettings'  selectionMode='Point'>
        <e-series-collection>
            <e-series [dataSource]='chartData' type='Column' xName='country' yName='gold' name='Gold'></e-series>
            <e-series [dataSource]='chartData' type='Column' xName='country' yName='silver' name='Silver'></e-series>
            <e-series [dataSource]='chartData' type='Column' xName='country' yName='bronze' name='Bronze'></e-series>
        </e-series-collection>
    </ejs-chart>`
})
export class AppComponent implements OnInit {
    public primaryXAxis?: Object;
    public primaryYAxis?: Object;
    public chartData?: Object[];
    public title?: string;
    public legendSettings?: Object;
    ngOnInit(): void {
        this.chartData = selectionData;
        this.primaryXAxis = {
           valueType: 'Category',
           title: 'Countries'
        };
        this.primaryYAxis = {
           title: 'Medals'
        };
        this.legendSettings = { visible: true, toggleVisibility: true, enableHighlight: true };
        this.title = 'Olympic Medals';
    }

}#loader {
color: #008cff;
font-family: 'Helvetica Neue','calibiri';
font-size:16px;
height: 40px;
left: 45%;
position: absolute;
top: 45%;
width: 30%;
}
.animation {
background: #333333;
border: 1px solid #cecece;
box-sizing: border-box;
height: 100px;
width: 100px;
}
#chart-container {
display: block;
height: 350px;
}
.chartSelection1 {
fill:red;
}
.chartSelection2 {
fill: green;
}
.chartSelection3 {
fill: blue;
}