Data Editing in Angular Chart
31 Aug 202615 minutes to read
Note: To use the data editing feature, inject
DataEditingServicefrom@syncfusion/ej2-angular-chartsinto the component’sproviders(for standalone components) or@NgModule.providers(for module-based components).
Data editing allows users to modify chart data points interactively by dragging the rendered points to new positions. This functionality adds drag-and-drop support for data points.
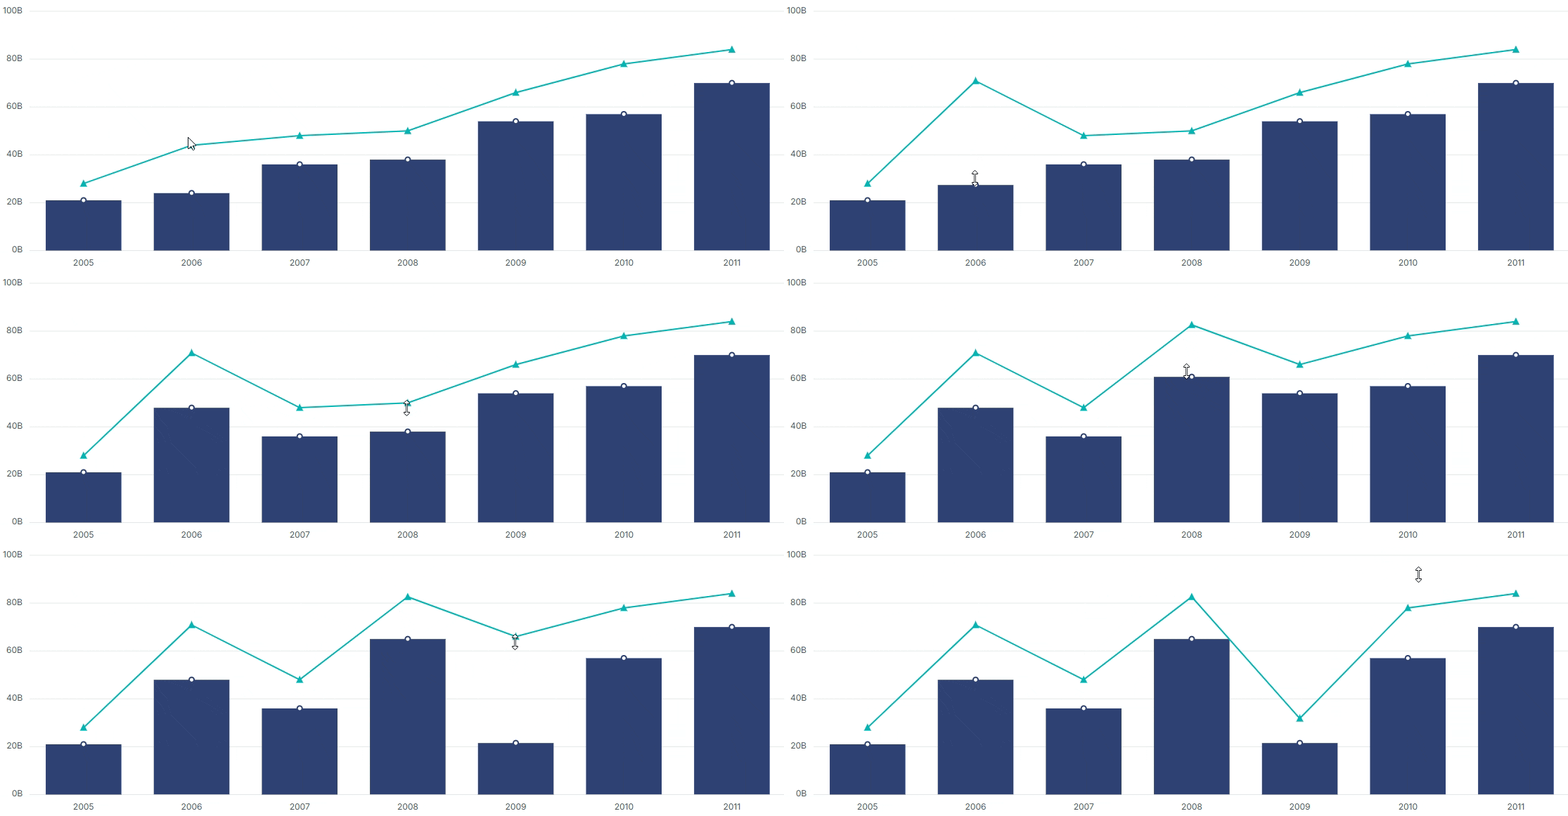
Enable data editing
To activate data editing, set the enable property of dragSettings to true on the corresponding series.
import { ChartModule } from '@syncfusion/ej2-angular-charts'
import { LineSeriesService, ColumnSeriesService, CategoryService, DataEditingService, TooltipService } from '@syncfusion/ej2-angular-charts'
import { LegendService } from '@syncfusion/ej2-angular-charts'
import { Component, OnInit } from '@angular/core';

@Component({
imports: [
         ChartModule
    ],

providers: [ LegendService, LineSeriesService, ColumnSeriesService, CategoryService, DataEditingService, TooltipService],
standalone: true,
    selector: 'app-container',
    template: `<ejs-chart id="chart-container" [primaryXAxis]='primaryXAxis' [primaryYAxis]='primaryYAxis' [title]='title'
            [chartArea]="chartArea" [tooltip]="tooltip">
        <e-series-collection>
            <e-series [dataSource]='columnData' type='Column' xName='x' yName='y' width="2" [marker]="marker" [dragSettings]="dragSettings"></e-series>
            <e-series [dataSource]='lineData' type='Line' xName='x' yName='y' width="2" [marker]="marker" [dragSettings]="dragSettings"></e-series>
        </e-series-collection>
    </ejs-chart>`
})
export class AppComponent implements OnInit {
    public primaryXAxis?: Object;
    public columnData?: Object[];
    public lineData?: Object[];
    public title?: string;
    public primaryYAxis?: Object;
    public chartArea?: Object;
    public marker?: Object;
    public dragSettings?: Object;
    public tooltip?: Object;
    ngOnInit(): void {
        this.columnData = [
                 { x: '2005', y: 21 }, { x: '2006', y: 60 },
                 { x: '2007', y: 45 }, { x: '2008', y: 50 },
                { x: '2009', y: 74 }, { x: '2010', y: 65 },
                { x: '2011', y: 85 }
        ];
        this.lineData = [
                 { x: '2005', y: 21 }, { x: '2006', y: 22 },
                    { x: '2007', y: 36 }, { x: '2008', y: 34 },
                    { x: '2009', y: 54 }, { x: '2010', y: 55 },
                    { x: '2011', y: 60 }
        ];
        this.primaryXAxis = {
            valueType: 'Category',
            minimum: -0.5,
            maximum: 6.5,
            labelPlacement: 'OnTicks',
            majorGridLines: { width: 0 },
        };
        this.primaryYAxis = {
           rangePadding: 'None',
            minimum: 0,
            title : 'Sales',
            labelFormat: '{value}%',
            maximum: 100,
            interval: 20,
            lineStyle: { width: 0 },
            majorTickLines: { width: 0 },
            minorTickLines: { width: 0 }
        };
        this.chartArea = {
            border: {
                width: 0
            }
        };
        this.title = 'Inflation - Consumer Price';
        this.marker = {
             visible: true,
             width: 10,
             height: 10
        };
        this.dragSettings = {
            enable: true
        };
        this.tooltip = {
            enable: true
        }
    }

}
import { bootstrapApplication } from '@angular/platform-browser';
import { AppComponent } from './app.component';
bootstrapApplication(AppComponent).catch((err) => console.error(err));Customization
The following dragSettings properties can be used to customize the data editing behavior and appearance:
-
fill— Sets the color of the editable data points. -
minYandmaxY— Define the minimum and maximum allowable range for editing the data points on the Y axis.
These options control both the visual feedback and the valid value range when editing data directly on the chart.
import { ChartModule, LineSeriesService, ColumnSeriesService, CategoryService, DataEditingService, TooltipService, LegendService, DragCompleteEventArgs } from '@syncfusion/ej2-angular-charts'
import { Component, OnInit } from '@angular/core';

@Component({
imports: [
         ChartModule
    ],

providers: [ LegendService, LineSeriesService, ColumnSeriesService, CategoryService, DataEditingService, TooltipService],
standalone: true,
    selector: 'app-container',
    template: `<ejs-chart id="chart-container" [primaryXAxis]='primaryXAxis' [primaryYAxis]='primaryYAxis' [title]='title'
            [chartArea]="chartArea" [tooltip]="tooltip" [dragComplete]="dragComplete">
        <e-series-collection>
            <e-series [dataSource]='columnData' type='Column' xName='x' yName='y' width="2" [marker]="marker" [dragSettings]="dragSettings"></e-series>
            <e-series [dataSource]='lineData' type='Line' xName='x' yName='y' width="2" [marker]="marker" [dragSettings]="dragSettings"></e-series>
        </e-series-collection>
    </ejs-chart>`
})
export class AppComponent implements OnInit {
    public primaryXAxis?: Object;
    public columnData?: Object[];
    public lineData?: Object[];
    public title?: string;
    public primaryYAxis?: Object;
    public chartArea?: Object;
    public marker?: Object;
    public dragSettings?: Object;
    public tooltip?: Object;
    public dragComplete?: (args: DragCompleteEventArgs) => void;
    ngOnInit(): void {
        this.columnData = [
                 { x: '2005', y: 21 }, { x: '2006', y: 60 },
                 { x: '2007', y: 45 }, { x: '2008', y: 50 },
                { x: '2009', y: 74 }, { x: '2010', y: 65 },
                { x: '2011', y: 85 }
        ];
        this.lineData = [
                 { x: '2005', y: 21 }, { x: '2006', y: 22 },
                    { x: '2007', y: 36 }, { x: '2008', y: 34 },
                    { x: '2009', y: 54 }, { x: '2010', y: 55 },
                    { x: '2011', y: 60 }
        ];
        this.primaryXAxis = {
            valueType: 'Category',
            minimum: -0.5,
            maximum: 6.5,
            labelPlacement: 'OnTicks',
            majorGridLines: { width: 0 },
        };
        this.primaryYAxis = {
           rangePadding: 'None',
            minimum: 0,
            title : 'Sales',
            labelFormat: '{value}%',
            maximum: 100,
            interval: 20,
            lineStyle: { width: 0 },
            majorTickLines: { width: 0 },
            minorTickLines: { width: 0 }
        };
        this.chartArea = {
            border: {
                width: 0
            }
        };
        this.title = 'Inflation - Consumer Price';
        this.marker = {
             visible: true,
             width: 10,
             height: 10
        };
        this.dragSettings = {
            enable: true,
            fill: 'red',
            minY: 0,
            maxY: 100
        };
        this.tooltip = {
            enable: true
        };
        this.dragComplete = (args: DragCompleteEventArgs) => {
            console.log(`Series ${args.seriesIndex}, Point ${args.pointIndex} moved to ${args.currentValue}`);
        };
    }

}
import { bootstrapApplication } from '@angular/platform-browser';
import { AppComponent } from './app.component';
bootstrapApplication(AppComponent).catch((err) => console.error(err));Events
The data editing feature raises the dragComplete event after the user drops a data point. Use this event to persist changes, validate the new value, or update related UI.
```ts
public dragComplete(args: any): void {
    // args.currentValue contains the new Y value
    // args.point.index and args.series.index identify the edited point
    console.log(`Series ${args.series.index}, Point ${args.point.index} moved to ${args.currentValue}`);
}
```

Bind it on the `<ejs-chart>` element:

```html
<ejs-chart id="chart-container" [dragComplete]="dragComplete" ...>
</ejs-chart>
```
Supported series types
Data editing is supported for the following series types: Line, Column, and Scatter.