Crosshair and Trackball in Angular Chart
31 Aug 202624 minutes to read
The crosshair displays a vertical and/or horizontal line that shows the axis value at the mouse or touch position.
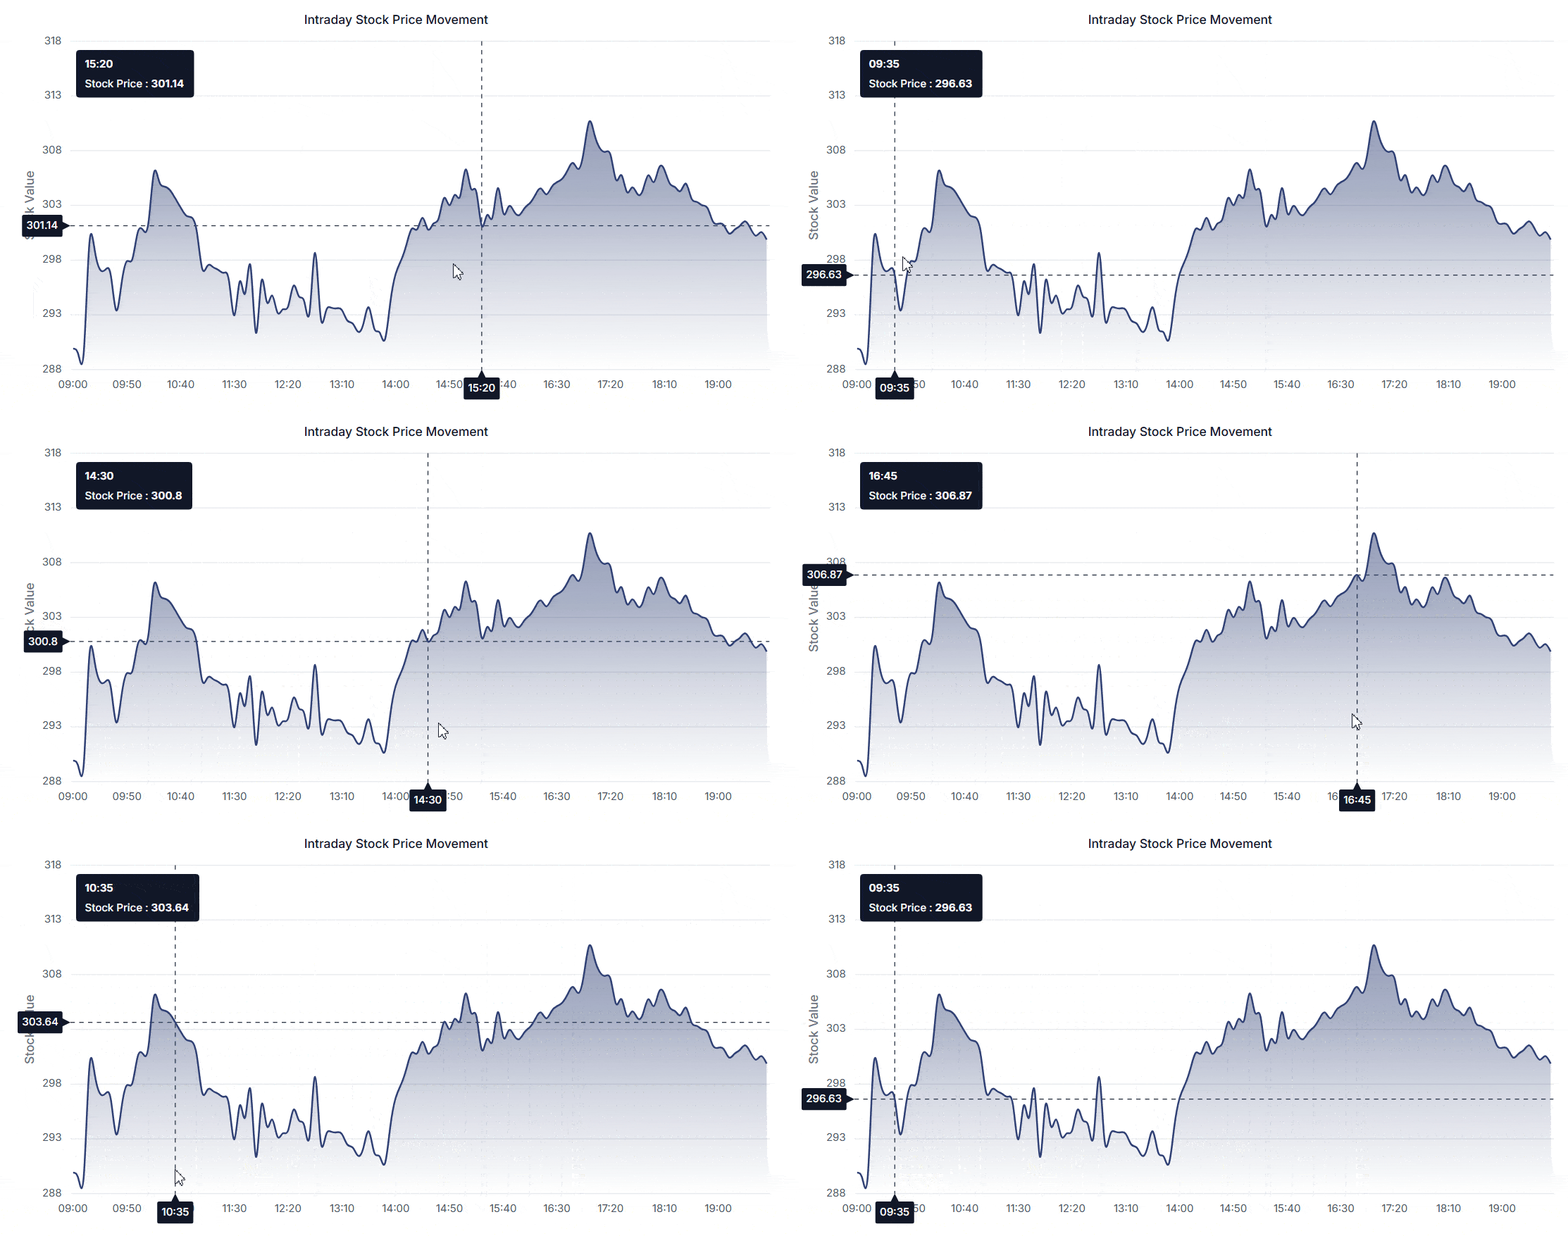
Note: To use the crosshair feature, inject
CrosshairServiceinto the component’sprovidersarray (or@NgModule.providersfor module-based apps).
Crosshair lines can be enabled by using the enable property in the crosshair.
import { ChartModule } from '@syncfusion/ej2-angular-charts'
import { DateTimeService, LineSeriesService } from '@syncfusion/ej2-angular-charts'
import { LegendService, CrosshairService } from '@syncfusion/ej2-angular-charts'
import { Component, OnInit } from '@angular/core';
import { ChartData } from './chartdata';

@Component({
imports: [
         ChartModule
    ],

providers: [ DateTimeService, LineSeriesService, LegendService, CrosshairService],
standalone: true,
    selector: 'app-container',
    template: `<ejs-chart id="chart-container" [primaryXAxis]='primaryXAxis'[primaryYAxis]='primaryYAxis' [title]='title' [legendSettings]='legend' [crosshair]='crosshair'>
        <e-series-collection>
            <e-series [dataSource]='series1' type='Line' xName='x' yName='y' name='Temperature'></e-series>
        </e-series-collection>
    </ejs-chart>`
})
export class AppComponent implements OnInit {
    public primaryXAxis?: Object;
    public series1?: Object[];
    public crosshair?: Object;
    public title?: string;
    public primaryYAxis?: Object;
    public legend?: Object;
    ngOnInit(): void {
        this.primaryXAxis = {
            valueType: 'DateTime',
            labelFormat: 'yMMM'
        };
        this.crosshair = { enable: true };
        this.series1 = ChartData.prototype.getCrosshairData().series1;
        this.legend = { visible: true };
        this.title = 'Weather Condition';
    }

}
/**
* chart data source
*/
export class ChartData {
getCrosshairData(): any {
let series1: Object[] = [];
let series2: Object[] = [];
let point1: Object;
let point2: Object;
let value: number = 60;
let value1: number = 50;
let i: number;
for (i = 1; i < 250; i++) {
if (Math.random() > .5) {
value += Math.random();
} else {
value -= Math.random();
}
point1 = { x: new Date(2000, i, 1), y: value };
series1.push(point1);
}
for (i = 1; i < 250; i++) {
if (Math.random() > .5) {
value1 += Math.random();
} else {
value1 -= Math.random();
}
point2 = { x: new Date(2000, i, 1), y: value1 };
series2.push(point2);
}
return { 'series1': series1, 'series2': series2};
}
}import { bootstrapApplication } from '@angular/platform-browser';
import { AppComponent } from './app.component';
bootstrapApplication(AppComponent).catch((err) => console.error(err));Axis tooltip
Tooltip label for an axis can be enabled by using the enable property of the crosshairTooltip in the corresponding axis.
import { ChartModule } from '@syncfusion/ej2-angular-charts'
import { DateTimeService, LineSeriesService } from '@syncfusion/ej2-angular-charts'
import { LegendService, CrosshairService } from '@syncfusion/ej2-angular-charts'
import { Component, OnInit } from '@angular/core';
import { ChartData } from './chartdata';

@Component({
imports: [
         ChartModule
    ],

providers: [ DateTimeService, LineSeriesService, LegendService, CrosshairService],
standalone: true,
    selector: 'app-container',
    template: `<ejs-chart id="chart-container" [primaryXAxis]='primaryXAxis'[primaryYAxis]='primaryYAxis' [title]='title' [legendSettings]='legend' [crosshair]='crosshair'>
        <e-series-collection>
            <e-series [dataSource]='series1' type='Line' xName='x' yName='y' name='Temperature'></e-series>
        </e-series-collection>
    </ejs-chart>`
})
export class AppComponent implements OnInit {
    public primaryXAxis?: Object;
    public series1?: Object[];
    public majorGridLines?: Object;
    public crosshair?: Object;
    public title?: string;
    public primaryYAxis?: Object;
    public legend?: Object;
    ngOnInit(): void {
        this.primaryXAxis = {
            valueType: 'DateTime',
            crosshairTooltip: { enable: true },
            labelFormat: 'yMMM'
        };
        this.primaryYAxis = {
            crosshairTooltip: { enable: true }
        };
        this.crosshair = { enable: true };
        this.series1 = ChartData.prototype.getCrosshairData().series1;
        this.legend = { visible: true };
        this.title = 'Weather Condition';
    }

}
/**
* chart data source
*/
export class ChartData {
getCrosshairData(): any {
let series1: Object[] = [];
let series2: Object[] = [];
let point1: Object;
let point2: Object;
let value: number = 60;
let value1: number = 50;
let i: number;
for (i = 1; i < 250; i++) {
if (Math.random() > .5) {
value += Math.random();
} else {
value -= Math.random();
}
point1 = { x: new Date(2000, i, 1), y: value };
series1.push(point1);
}
for (i = 1; i < 250; i++) {
if (Math.random() > .5) {
value1 += Math.random();
} else {
value1 -= Math.random();
}
point2 = { x: new Date(2000, i, 1), y: value1 };
series2.push(point2);
}
return { 'series1': series1, 'series2': series2};
}
}import { bootstrapApplication } from '@angular/platform-browser';
import { AppComponent } from './app.component';
bootstrapApplication(AppComponent).catch((err) => console.error(err));Customization
The fill and textStyle properties of the crosshairTooltip are used to customize the background color and font style of the crosshair label, respectively. The color and width of the crosshair line can be customized by using the line property in the crosshair.
import { ChartModule } from '@syncfusion/ej2-angular-charts'
import { DateTimeService, LineSeriesService } from '@syncfusion/ej2-angular-charts'
import { LegendService, CrosshairService } from '@syncfusion/ej2-angular-charts'
import { Component, OnInit } from '@angular/core';
import { ChartData } from './chartdata';

@Component({
imports: [
         ChartModule
    ],

providers: [ DateTimeService, LineSeriesService, LegendService, CrosshairService],
standalone: true,
    selector: 'app-container',
    template: `<ejs-chart id="chart-container" [primaryXAxis]='primaryXAxis'[primaryYAxis]='primaryYAxis' [title]='title' [legendSettings]='legend' [crosshair]='crosshair'>
        <e-series-collection>
            <e-series [dataSource]='series1' type='Line' xName='x' yName='y' name='Temperature'></e-series>
        </e-series-collection>
    </ejs-chart>`
})
export class AppComponent implements OnInit {
    public primaryXAxis?: Object;
    public series1?: Object[];
    public crosshair?: Object;
    public title?: string;
    public primaryYAxis?: Object;
    public legend?: Object;
    ngOnInit(): void {
        this.primaryXAxis = {
            valueType: 'DateTime',
            crosshairTooltip: { enable: true, fill: 'green' },
            labelFormat: 'yMMM'
        };
        this.primaryYAxis = {
            crosshairTooltip: { enable: true, fill: 'green' }
        };
        this.crosshair = { enable: true, line: {width: 2, color: 'green'}, fill: 'green' };
        this.series1 = ChartData.prototype.getCrosshairData().series1;
        this.legend = { visible: true};
        this.title = 'Weather Condition';
    }

}
/**
* chart data source
*/
export class ChartData {
getCrosshairData(): any {
let series1: Object[] = [];
let series2: Object[] = [];
let point1: Object;
let point2: Object;
let value: number = 60;
let value1: number = 50;
let i: number;
for (i = 1; i < 250; i++) {
if (Math.random() > .5) {
value += Math.random();
} else {
value -= Math.random();
}
point1 = { x: new Date(2000, i, 1), y: value };
series1.push(point1);
}
for (i = 1; i < 250; i++) {
if (Math.random() > .5) {
value1 += Math.random();
} else {
value1 -= Math.random();
}
point2 = { x: new Date(2000, i, 1), y: value1 };
series2.push(point2);
}
return { 'series1': series1, 'series2': series2};
}
}import { bootstrapApplication } from '@angular/platform-browser';
import { AppComponent } from './app.component';
bootstrapApplication(AppComponent).catch((err) => console.error(err));Snap to data
Enabling the snapToData property in the crosshair aligns the line with the nearest data point on both axes instead of following the exact mouse position.
import { ChartModule } from '@syncfusion/ej2-angular-charts';
import { DateTimeService, LineSeriesService, TooltipService, CrosshairService, LegendService } from '@syncfusion/ej2-angular-charts';
import { Component, OnInit } from '@angular/core';
import { chartData } from './datasource';

@Component({
    imports: [ChartModule],
    providers: [DateTimeService, LineSeriesService, TooltipService, CrosshairService, LegendService],
    standalone: true,
    selector: 'app-container',
    template: `<ejs-chart id="chart-container" [primaryXAxis]='primaryXAxis' [primaryYAxis]='primaryYAxis' [title]='title' [crosshair]='crosshair' [tooltip]='tooltip' [legendSettings]='legendSettings'>
        <e-series-collection>
            <e-series [dataSource]='chartData' type='Line' xName='x' yName='y' name='John' width='2' [marker]='marker'></e-series>
        </e-series-collection>
    </ejs-chart>`
})
export class AppComponent implements OnInit {
    public primaryXAxis?: Object;
    public primaryYAxis?: Object;
    public chartData?: Object[];
    public crosshair?: Object;
    public title?: string;
    public tooltip?: Object;
    public marker?: Object;
    public legendSettings?: Object;
    ngOnInit(): void {
        this.chartData = chartData;
        this.primaryXAxis = {
            title: 'Years',
            minimum: new Date(2000, 1, 1), maximum: new Date(2006, 2, 11),
            intervalType: 'Years',
            valueType: 'DateTime',
            lineStyle: { width: 0 },
            majorGridLines: { width: 0 },
            edgeLabelPlacement: 'Shift'
        };
        this.primaryYAxis = {
            title: 'Revenue in Millions',
            labelFormat: '{value}M',
            majorTickLines: { width: 0 },
            minimum: 10, maximum: 60,
            lineStyle: { width: 0 }
        };
        this.crosshair = { enable: true, snapToData: true };
        this.tooltip = { enable: true, shared: true, format: '${series.name} : ${point.x} : ${point.y}' };
        this.title = 'Average Sales per Person';
        this.marker = { visible: true };
        this.legendSettings = { visible: false };
    }

}
import { bootstrapApplication } from '@angular/platform-browser';
import { AppComponent } from './app.component';
bootstrapApplication(AppComponent).catch((err) => console.error(err));Trackball
Trackball is used to track the data point closest to the mouse or touch position. The trackball marker indicates the closest point and the trackball tooltip displays the information about that point. To use the trackball feature, inject CrosshairService and TooltipService into the component’s providers array (or @NgModule.providers for module-based apps).
The trackball can be enabled by:
- Setting the
enableproperty of thecrosshairto true. - Setting the
lineTypeproperty of thecrosshairto Vertical (recommended so the line snaps to a single x-coordinate across all series). - Setting the
sharedproperty intooltipto true.
import { ChartModule } from '@syncfusion/ej2-angular-charts'
import { DateTimeService, LineSeriesService } from '@syncfusion/ej2-angular-charts'
import { LegendService, DataLabelService, TooltipService, CrosshairService } from '@syncfusion/ej2-angular-charts'
import { Component, OnInit } from '@angular/core';

@Component({
imports: [
         ChartModule
    ],

providers: [ DateTimeService, LineSeriesService, LegendService, DataLabelService,
                 TooltipService, CrosshairService],
standalone: true,
    selector: 'app-container',
    template: `<ejs-chart id="chart-container" [primaryXAxis]='primaryXAxis'[primaryYAxis]='primaryYAxis' [title]='title' [crosshair]='crosshair' [tooltip]='tooltip'>
        <e-series-collection>
            <e-series [dataSource]='chartData' type='Line' xName='x' yName='y' name='John' width=2 [marker]='marker'></e-series>
            <e-series [dataSource]='chartData' type='Line' xName='x' yName='y1' name='Andrew' width=2 [marker]='marker'></e-series>
            <e-series [dataSource]='chartData' type='Line' xName='x' yName='y2' name='Thomas' width=2 [marker]='marker'></e-series>
            <e-series [dataSource]='chartData' type='Line' xName='x' yName='y3' name='Mark' width=2 [marker]='marker'></e-series>
            <e-series [dataSource]='chartData' type='Line' xName='x' yName='y4' name='William' width=2 [marker]='marker'></e-series>
        </e-series-collection>
    </ejs-chart>`
})
export class AppComponent implements OnInit {
    public primaryXAxis?: Object;
    public primaryYAxis?: Object;
    public chartData?: Object[];
    public crosshair?: Object;
    public title?: string;
    public tooltip?: Object;
    public marker?: Object;
    ngOnInit(): void {
        this.chartData = [
            { x: new Date(2000, 2, 11), y: 15, y1: 39, y2: 60, y3: 75, y4: 85 },
            { x: new Date(2000, 9, 14), y: 20, y1: 30, y2: 55, y3: 75, y4: 83 },
            { x: new Date(2001, 2, 11), y: 25, y1: 28, y2: 48, y3: 68, y4: 85 },
            { x: new Date(2001, 9, 16), y: 21, y1: 35, y2: 57, y3: 75, y4: 87 },
            { x: new Date(2002, 2, 7), y: 13, y1: 39, y2: 62, y3: 71, y4: 82 },
            { x: new Date(2002, 9, 7), y: 18, y1: 41, y2: 64, y3: 69, y4: 74 },
            { x: new Date(2003, 2, 11), y: 24, y1: 45, y2: 57, y3: 81, y4: 73 },
            { x: new Date(2003, 9, 14), y: 23, y1: 48, y2: 53, y3: 84, y4: 75 },
            { x: new Date(2004, 2, 6), y: 19, y1: 54, y2: 63, y3: 85, y4: 73 },
            { x: new Date(2004, 9, 6), y: 31, y1: 55, y2: 50, y3: 87, y4: 60 },
            { x: new Date(2005, 2, 11), y: 39, y1: 57, y2: 66, y3: 75, y4: 48 },
            { x: new Date(2005, 9, 11), y: 50, y1: 60, y2: 65, y3: 70, y4: 55 },
            { x: new Date(2006, 2, 11), y: 24, y1: 60, y2: 79, y3: 85, y4: 40 }
        ];
        this.primaryXAxis = {
            title: 'Years',
            minimum: new Date(2000, 1, 1), maximum: new Date(2006, 2, 11),
            intervalType: 'Years',
            valueType: 'DateTime',
        };
        this.tooltip = { enable: true, shared: true, format: '${series.name} : ${point.x} : ${point.y}' };
        this.crosshair = { enable: true, lineType: 'Vertical' };
        this.marker = { visible: true };
        this.title = 'Average Sales per Person';
    }

}
import { bootstrapApplication } from '@angular/platform-browser';
import { AppComponent } from './app.component';
bootstrapApplication(AppComponent).catch((err) => console.error(err));To know more about Crosshair and Trackball, you can check on this video:
Crosshair highlight
The highlightCategory property in the crosshair highlights the background of the entire category when the user hovers over the chart. The crosshair color can be customized using the color property within the line configuration.
import { ChartModule } from '@syncfusion/ej2-angular-charts'
import { CategoryService, ColumnSeriesService, LegendService, CrosshairService } from '@syncfusion/ej2-angular-charts'
import { Component, OnInit } from '@angular/core';

@Component({
imports: [
         ChartModule
    ],

providers: [ CategoryService, ColumnSeriesService, LegendService, CrosshairService],
standalone: true,
    selector: 'app-container',
    template: `<ejs-chart id="chart-container" [primaryXAxis]='primaryXAxis'[primaryYAxis]='primaryYAxis' [title]='title' [crosshair]='crosshair' >
        <e-series-collection>
            <e-series [dataSource]='chartData' type='Column' xName='country' yName='gold' name='Gold'></e-series>
        </e-series-collection>
    </ejs-chart>`
})
export class AppComponent implements OnInit {
    public primaryXAxis?: Object;
    public chartData?: Object[];
    public title?: string;
    public primaryYAxis?: Object;
    public crosshair?: Object;
    ngOnInit(): void {
        this.chartData = [
             { country: "USA", gold: 50 },
             { country: "China", gold: 40 },
             { country: "Japan", gold: 70 },
             { country: "Australia", gold: 60 },
             { country: "France", gold: 50 },
             { country: "Germany", gold: 40 },
             { country: "Italy", gold: 40 },
             { country: "Sweden", gold: 30, silver: 25 }
        ];
        this.primaryXAxis = {
            valueType: 'Category',
            title: 'Countries'
        };
        this.crosshair = { enable: true, line: { color: 'red' }, lineType: 'Vertical', highlightCategory: true };
        this.primaryYAxis = {
            minimum: 0, maximum: 80,
            interval: 20, title: 'Medals'
        };
        this.title = 'Olympic Medals';
    }

}
import { bootstrapApplication } from '@angular/platform-browser';
import { AppComponent } from './app.component';
bootstrapApplication(AppComponent).catch((err) => console.error(err));Crosshair Label Customization
The crosshairLabelRender event fires before each crosshair axis label is rendered, allowing you to customize the label’s appearance or content, or to prevent it from being displayed. The event handler argument is typed as ICrosshairLabelRenderEventArgs and exposes the following properties:
-
text- The label text that can be modified. -
value- The data value at the crosshair position. -
axisName- The axis identifier (for example,primaryXAxisorprimaryYAxis). -
axisOrientation- EitherHorizontalorVertical(seeAxisOrientation). -
textStyle- A nestedFontModelobject whose properties (such ascolor,size,fontWeight) can be modified to customize the label font. -
fill- Background color of the label. -
cancel- Set to true to skip rendering the label.
import { Component, OnInit } from '@angular/core';
import { ChartAllModule, ICrosshairLabelRenderEventArgs } from '@syncfusion/ej2-angular-charts';
import { LineSeriesService, CrosshairService, CategoryService } from '@syncfusion/ej2-angular-charts';

import { data } from './datasource';

@Component({
    imports: [
        ChartAllModule
    ],
    providers: [LineSeriesService, CrosshairService, CategoryService],
    standalone: true,
    selector: 'app-container',
    template: `<ejs-chart id="charts" [primaryXAxis]="primaryXAxis" [primaryYAxis]="primaryYAxis"
        [crosshair]="crosshair" (crosshairLabelRender)="crosshairLabelRender($event)">
        <e-series-collection>
            <e-series [dataSource]="chartData" type="Line" xName="x" yName="y" name="Series"></e-series>
        </e-series-collection>
    </ejs-chart>`
})
export class AppComponent implements OnInit {
    public primaryXAxis?: Object;
    public primaryYAxis?: Object;
    public crosshair?: Object;
    public chartData?: Object[];

    ngOnInit(): void {
        this.chartData = data;

        this.primaryXAxis = {
            valueType: 'Category',
            crosshairTooltip: { enable: true }
        };

        this.primaryYAxis = {
            crosshairTooltip: { enable: true }
        };

        this.crosshair = { enable: true };
    }

    crosshairLabelRender(args: ICrosshairLabelRenderEventArgs): void {
        if (args.axisName === 'primaryYAxis' && typeof args.value === 'number') {
            if (args.value > 1000) {
                args.text = (args.value / 1000).toFixed(1) + 'K';
                args.textStyle = args.textStyle || {};
                args.textStyle.color = '#d32f2f';
                args.fill = '#ffebee';
            }
            if (args.value < 0) {
                args.cancel = true;
            }
        }

        if (args.axisOrientation === 'Horizontal' && typeof args.text === 'string') {
            if (args.text.length > 8) {
                args.text = args.text.substring(0, 8) + '...';

            }
        }
    }
}
import { bootstrapApplication } from '@angular/platform-browser';
import { AppComponent } from './app.component';
bootstrapApplication(AppComponent).catch((err) => console.error(err));export const data: { x: string; y: number }[] = [
{ x: 'January', y: 1200 },
{ x: 'February', y: 900 },
{ x: 'March', y: 1500 },
{ x: 'April', y: 700 },
{ x: 'May', y: 2000 },
{ x: 'June', y: 300 },
];