Stripline in Angular Chart
31 Aug 202624 minutes to read
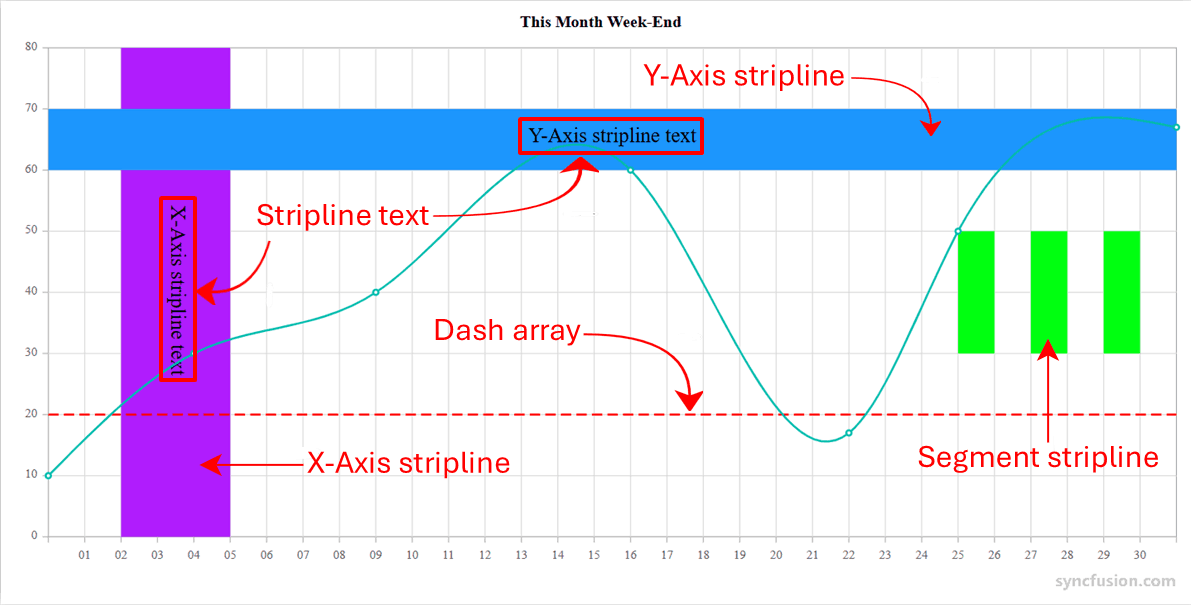
The Angular Chart component supports both horizontal and vertical strip lines, which act as visual guides to highlight specific ranges within the chart area. Strip lines can be added to either axis and customized to suit your visualization needs.
Horizontal striplines
Horizontal strip lines are created by adding the stripLines configuration to the primary value (Y) axis and setting the visible property to true. They highlight horizontal ranges in the chart, and multiple strip lines can be added to the same axis.
import { ChartModule } from '@syncfusion/ej2-angular-charts'
import { StripLineService, ColumnSeriesService, DataLabelService, LineSeriesService } from '@syncfusion/ej2-angular-charts'
import { Component, OnInit } from '@angular/core';
import { stripData } from './datasource';
@Component({
imports: [
         ChartModule
    ],

providers: [ StripLineService, ColumnSeriesService, DataLabelService, LineSeriesService ],
standalone: true,
    selector: 'app-container',
    template: `<ejs-chart id="chart-container" [primaryXAxis]='primaryXAxis'[primaryYAxis]='primaryYAxis' [title]='title'>
        <e-series-collection>
            <e-series [dataSource]='chartData' type='Column' xName='x' yName='y' name='Internet'></e-series>>
        </e-series-collection>
    </ejs-chart>`
})
export class AppComponent implements OnInit {
    public primaryXAxis?: Object;
    public chartData?: Object[];
    public title?: string;
    public primaryYAxis?: Object;
    ngOnInit(): void {
        this.chartData =  [{x: 1, y: 20},{x: 2, y: 22},{x: 3, y: 0},{x: 4, y: 12},{x: 5, y: 5},
                 {x: 6, y: 15},{x: 7, y: 6},{x: 8, y: 12},{x: 9, y: 20},{x: 10, y: 7}];
        this.primaryYAxis = {
           title: 'Runs',
            stripLines:[
            { start: 15, end: 22, text: 'Good', color: '#ff512f', visible: true, zIndex: 'Behind', opacity: 0.5 },
            { start: 8, end: 15, text: 'Medium', color: 'pink', opacity: 0.5, visible: true, zIndex: 'Behind' },
            { start: 0, end: 8, text:'Not enough', color: 'skyblue', opacity: 0.5, visible: true, zIndex: 'Behind' }]
        };
        this.primaryXAxis = {
            title: 'Overs'
        };
        this.title = 'India Vs Australia 1st match';
    }

}
import { bootstrapApplication } from '@angular/platform-browser';
import { AppComponent } from './app.component';
bootstrapApplication(AppComponent).catch((err) => console.error(err));Vertical striplines
Vertical strip lines are created by adding the stripLines configuration to the primary category (X) axis and enabling the visible property. They highlight vertical regions in the chart and support multiple entries for an axis.
import { ChartModule } from '@syncfusion/ej2-angular-charts'
import { StripLineService, ColumnSeriesService, DataLabelService, LineSeriesService } from '@syncfusion/ej2-angular-charts'
import { Component, OnInit } from '@angular/core';
import { stripData } from './datasource';
@Component({
imports: [
         ChartModule
    ],

providers: [ StripLineService, ColumnSeriesService, DataLabelService, LineSeriesService ],
standalone: true,
    selector: 'app-container',
    template: `<ejs-chart id="chart-container" [primaryXAxis]='primaryXAxis'[primaryYAxis]='primaryYAxis' [title]='title'>
        <e-series-collection>
            <e-series [dataSource]='chartData' type='Column' xName='x' yName='y' name='Internet'></e-series>>
        </e-series-collection>
    </ejs-chart>`
})
export class AppComponent implements OnInit {
    public primaryXAxis?: Object;
    public chartData?: Object[];
    public title?: string;
    public primaryYAxis?: Object;
    ngOnInit(): void {
        this.chartData =  [{x: 1, y: 20},{x: 2, y: 22},{x: 3, y: 0},{x: 4, y: 12},{x: 5, y: 5},
                 {x: 6, y: 15},{x: 7, y: 6},{x: 8, y: 12},{x: 9, y: 20},{x: 10, y: 7}];
        this.primaryYAxis = {
           title: 'Runs',

        };
        this.primaryXAxis = {
           title: 'Overs',
            stripLines:[
            {start: 0, end: 5, text: 'powerplay 1', color: 'red', visible: true, opacity: 0.5, rotation: 45, textStyle: { size: 20, color: 'black'}},
            {start: 5, end: 10, text: 'powerplay 2', color: 'blue', visible: true, opacity: 0.5, rotation: 45, textStyle: { size: 20, color: 'black'}},
        ]
        };
        this.title = 'India Vs Australia 1st match';
    }

}
import { bootstrapApplication } from '@angular/platform-browser';
import { AppComponent } from './app.component';
bootstrapApplication(AppComponent).catch((err) => console.error(err));Stripline as band and line
A stripline can render as either a filled band (a region spanning from start to end) or a thin line (when start and end are very close). Specify the start and end values, along with any desired styling properties, within the StripLineSettingsModel to switch between these visual forms.
import { AreaSeriesService, ChartModule } from '@syncfusion/ej2-angular-charts';
import {
  StripLineService,
  ColumnSeriesService,
  DataLabelService,
  LineSeriesService,
} from '@syncfusion/ej2-angular-charts';

import { Component, OnInit } from '@angular/core';
import { stripData } from './datasource';
@Component({
  imports: [ChartModule],

  providers: [
    StripLineService,
    AreaSeriesService,
    ColumnSeriesService,
    DataLabelService,
    LineSeriesService,
  ],
  standalone: true,
  selector: 'app-container',
  template: `<ejs-chart id="chart-container" [primaryXAxis]='primaryXAxis'[primaryYAxis]='primaryYAxis' [title]='title'>
        <e-series-collection>
            <e-series [dataSource]='chartData' type='Line' xName='x' width='2' yName='y' name='Internet'></e-series>>
        </e-series-collection>
    </ejs-chart>`,
})
export class AppComponent implements OnInit {
  public primaryXAxis?: Object;
  public chartData?: Object[];
  public title?: string;
  public primaryYAxis?: Object;
  ngOnInit(): void {
    this.chartData = [
      { x: 1, y: 5 },
      { x: 2, y: 15 },
      { x: 3, y: 0 },
      { x: 4, y: 12 },
      { x: 5, y: 5 },
      { x: 6, y: 8 },
      { x: 7, y: 6 },
      { x: 8, y: 12 },
      { x: 9, y: 20 },
      { x: 10, y: 7 },
    ];
    this.primaryYAxis = {
      title: 'Runs',
      stripLines: [
        {
          start: 20,
          end: 24,
          text: 'Y-axis Plot Band',
          color: '#ff512f',
          visible: true,
          textStyle: { size: 15, textAlignment: 'Far', color: 'black' },
        },
        {
          start: 0.5,
          end: 0.7,
          text: 'Y-Axis Plot Line',
          color: 'Red',
          visible: true,
          textStyle: { size: 15, textAlignment: 'Far', color: 'black' },
        },
      ],
    };
    this.primaryXAxis = {
      title: 'Overs',
      stripLines: [
        {
          start: 1.4,
          end: 1.45,
          text: 'X-Axis Plot Line',
          color: 'red',
          visible: true,
          textStyle: { size: 15, textAlignment: 'Far', color: 'black' },
        },
        {
          start: 5,
          end: 7,
          text: 'X-Axis Plot Band',
          color: 'blue',
          visible: true,
          opacity: 0.5,
          textStyle: { size: 15, color: 'black' },
        },
      ],
    };
    this.title = 'India Vs Australia 1st match';
  }
}
import { bootstrapApplication } from '@angular/platform-browser';
import { AppComponent } from './app.component';
bootstrapApplication(AppComponent).catch((err) => console.error(err));Customize the strip line
Strip lines can be customized to highlight specific regions more effectively:
- Use
startto set the beginning value of the strip line. - Use
endto define the ending value. - Use
startFromOriginto begin the strip line from the axis origin. WhenstartFromOriginis enabled, the start position defaults to the axis minimum andsizedefines the strip line’s length. - Use
sizeto specify the strip line height or width (based on orientation). - Use
colorto set the fill or stroke color of the strip line. - Use
opacityto control the transparency of the strip line (values between 0 and 1). - Use
textto display a label inside the strip line. - Use
borderto customize border appearance. - Use
zIndexto control whether the strip line appears behind or above chart series.
import { ChartModule } from '@syncfusion/ej2-angular-charts'
import { StripLineService, ColumnSeriesService, DataLabelService, LineSeriesService } from '@syncfusion/ej2-angular-charts'
import { Component, OnInit } from '@angular/core';
import { stripData } from './datasource';

@Component({
imports: [
         ChartModule
    ],

providers: [ StripLineService, ColumnSeriesService, DataLabelService, LineSeriesService ],
standalone: true,
    selector: 'app-container',
    template: `<ejs-chart id="chart-container" [primaryXAxis]='primaryXAxis'[primaryYAxis]='primaryYAxis' [title]='title'>
        <e-series-collection>
            <e-series [dataSource]='chartData' type='Column' xName='x' yName='y' name='Internet'></e-series>>
        </e-series-collection>
    </ejs-chart>`
})
export class AppComponent implements OnInit {
    public primaryXAxis?: Object;
    public chartData?: Object[];
    public title?: string;
    public primaryYAxis?: Object;
    ngOnInit(): void {
        this.chartData = [
                 {x: 1, y: 20},{x: 2, y: 22},{x: 3, y: 0},{x: 4, y: 12},{x: 5, y: 5},
                 {x: 6, y: 15},{x: 7, y: 6},{x: 8, y: 12},{x: 9, y: 20},{x: 10, y: 7}
        ];
        this.primaryYAxis = {
           title: 'Runs',
        };
        this.primaryXAxis = {
            stripLines:[
            { startFromOrigin: true, size: 4, zIndex: 'Behind', opacity: 0.5, border: { width: 2, color:'red'}}
        ],
            title: 'Overs'
        };
        this.title = 'India Vs Australia 1st match';
    }

}
import { bootstrapApplication } from '@angular/platform-browser';
import { AppComponent } from './app.component';
bootstrapApplication(AppComponent).catch((err) => console.error(err));Customize the stripline text
Strip line text labels can be customized for readability and visual presentation:
- Use
textto define the label content. - Use
textStyleto set text appearance (size, color, font). - Use
rotationto rotate the strip line text. - Use
horizontalAlignmentandverticalAlignmentto adjust label placement.
import { ChartModule } from '@syncfusion/ej2-angular-charts'
import { StripLineService, ColumnSeriesService, DataLabelService, LineSeriesService } from '@syncfusion/ej2-angular-charts'
import { Component, OnInit } from '@angular/core';
import { stripData } from './datasource';
@Component({
imports: [
         ChartModule
    ],

providers: [ StripLineService, ColumnSeriesService, DataLabelService, LineSeriesService ],
standalone: true,
    selector: 'app-container',
    template: `<ejs-chart id="chart-container" [primaryXAxis]='primaryXAxis'[primaryYAxis]='primaryYAxis' [title]='title'>
        <e-series-collection>
            <e-series [dataSource]='chartData' type='Column' xName='x' yName='y' name='Internet'></e-series>>
        </e-series-collection>
    </ejs-chart>`
})
export class AppComponent implements OnInit {
    public primaryXAxis?: Object;
    public chartData?: Object[];
    public title?: string;
    public primaryYAxis?: Object;
    ngOnInit(): void {
        this.chartData = [
                 {x: 1, y: 20},{x: 2, y: 22},{x: 3, y: 0},{x: 4, y: 12},{x: 5, y: 5},
                 {x: 6, y: 15},{x: 7, y: 6},{x: 8, y: 12},{x: 9, y: 20},{x: 10, y: 7}
        ];
        this.primaryYAxis = {
           title: 'Runs',
        };
        this.primaryXAxis = {
            stripLines:[
            { startFromOrigin: true, size: 4, zIndex: 'Behind', opacity: 0.5,  text: 'Good', verticalAlignment: 'Middle', horizontalAlignment: 'Middle', rotation: 90, textStyle: { size: 15}},
            { start: 5, end: 8, verticalAlignment: 'Start', horizontalAlignment: 'End', rotation: 45, text: 'Poor'}
        ],
            title: 'Overs'
        };
        this.title = 'India Vs Australia 1st match';
    }

}
import { bootstrapApplication } from '@angular/platform-browser';
import { AppComponent } from './app.component';
bootstrapApplication(AppComponent).catch((err) => console.error(err));Dash array
Dashed strip lines can be rendered using the dashArray property. The value is a comma-separated list of numbers, where odd entries define the dash length and even entries define the gap length (in pixels). For example, "5,5" produces a 5-pixel dash followed by a 5-pixel gap.
import { ChartModule } from '@syncfusion/ej2-angular-charts'
import { StripLineService, ColumnSeriesService, DataLabelService, LineSeriesService } from '@syncfusion/ej2-angular-charts'
import { Component, OnInit } from '@angular/core';
import { stripData } from './datasource';

@Component({
imports: [
         ChartModule
    ],

providers: [ StripLineService, ColumnSeriesService, DataLabelService, LineSeriesService ],
standalone: true,
    selector: 'app-container',
    template: `<ejs-chart id="chart-container" [primaryYAxis]='primaryYAxis'>
        <e-series-collection>
            <e-series [dataSource]='chartData' type='Line' xName='x' yName='y' [marker]='marker'></e-series>>
        </e-series-collection>
    </ejs-chart>`
})
export class AppComponent implements OnInit {
    public primaryXAxis?: Object;
    public chartData?: Object[];
    public primaryYAxis?: Object;
    public marker?: Object;
    ngOnInit(): void {
        this.chartData = [
            {x: 1, y: 5},{x: 2, y: 39},{x: 3, y: 21},{x: 4, y: 51},{x: 5, y: 30},
            {x: 6, y: 25},{x: 7, y: 10},{x: 8, y: 40},{x: 9, y: 50},{x: 10, y: 20}
            ];
        this.primaryYAxis = {
           minimum: 0, maximum: 60, interval: 10,
        stripLines:[
            { start: 30, size: 2, sizeType: 'Pixel', dashArray:"10,5", color: "red"}
        ]
        };
        this.marker = { visible: true }
    }

}
import { bootstrapApplication } from '@angular/platform-browser';
import { AppComponent } from './app.component';
bootstrapApplication(AppComponent).catch((err) => console.error(err));Recurrence stripline
Strip lines can be drawn repeatedly at regular intervals — useful when you want to mark an event that occurs recursively along the timeline of the chart. The following properties configure this feature.
-
isRepeat- Enables or disables the recurrence strip line. -
repeatEvery- Specifies the stripline interval. The units must match the associated axis value type (for example, use years with aDateTimeaxis). -
repeatUntil- Specifies the end value at which the strip line stops repeating. If omitted, the strip line repeats until the axis maximum.
import { ChartModule } from '@syncfusion/ej2-angular-charts'
import { StripLineService, ColumnSeriesService, DataLabelService, LineSeriesService } from '@syncfusion/ej2-angular-charts'
import { Component, OnInit } from '@angular/core';
import { stripData } from './datasource';

@Component({
imports: [
         ChartModule
    ],

providers: [ StripLineService, ColumnSeriesService, DataLabelService, LineSeriesService ],
standalone: true,
    selector: 'app-container',
    template: `<ejs-chart id="chart-container" [primaryXAxis]='primaryXAxis'>
        <e-series-collection>
            <e-series [dataSource]='chartData' type='Line' xName='x' yName='y' [marker]='marker'></e-series>>
        </e-series-collection>
    </ejs-chart>`
})
export class AppComponent implements OnInit {
    public primaryXAxis?: Object;
    public chartData?: Object[];
    public marker?: Object;
    ngOnInit(): void {
        this.chartData = [
            {x: 1, y: 5},{x: 2, y: 39},{x: 3, y: 21},{x: 4, y: 51},{x: 5, y: 30},
            {x: 6, y: 25},{x: 7, y: 10},{x: 8, y: 40},{x: 9, y: 50},{x: 10, y: 20}
            ];
        this.primaryXAxis = {
            stripLines:[
            {start: 1, size: 1, isRepeat: true, repeatEvery: 2, color: 'rgba(167,169,171, 0.3)'}
        ]
        };
        this.marker = { visible: true }
    }

}
import { bootstrapApplication } from '@angular/platform-browser';
import { AppComponent } from './app.component';
bootstrapApplication(AppComponent).catch((err) => console.error(err));Size type
The sizeType property determines how the strip line size value is interpreted. Use Pixel for a fixed pixel width, or use Years, Months, Days, Hours, Minutes, or Seconds when the associated axis is a DateTime axis and the size should be measured in those units. Auto lets the chart choose based on the axis context.
Supported units include:
AutoPixelYearsMonthsDaysHoursMinutesSeconds
For more details on working with date-time axes, see DateTime Axis.
import { ChartModule } from '@syncfusion/ej2-angular-charts'
import { DateTimeService, LineSeriesService, DateTimeCategoryService, StripLineService } from '@syncfusion/ej2-angular-charts'
import { Component, OnInit } from '@angular/core';

@Component({
imports: [
         ChartModule
    ],

providers: [ DateTimeService, LineSeriesService, DateTimeCategoryService, StripLineService],
standalone: true,
    selector: 'app-container',
    template: `<ejs-chart id="chart-container" [primaryXAxis]='primaryXAxis' [primaryYAxis]='primaryYAxis'>
        <e-series-collection>
            <e-series [dataSource]='chartData' type='Line' xName='x' yName='y' [marker]='marker'></e-series>
        </e-series-collection>
    </ejs-chart>`
})
export class AppComponent implements OnInit {
    public primaryXAxis?: Object;
    public chartData?: Object[];
    public primaryYAxis?: Object;
    public marker?: Object;
    ngOnInit(): void {
        this.chartData =  [{ x: new Date(2000, 0, 1), y: 10 }, { x: new Date(2002, 0, 1), y: 40 },
    { x: new Date(2004, 0, 1), y: 20 }, { x: new Date(2006, 0, 1), y: 50 },
    { x: new Date(2008, 0, 1), y: 15 }, { x: new Date(2010, 0, 1), y: 30 }];
        this.primaryXAxis = {
            valueType: 'DateTime', intervalType: 'Years',
       stripLines:[
            {start:new Date(2002, 0, 1) , size: 2, sizeType: 'Years', color: 'rgba(167,169,171, 0.3)'}
            ]
        };
        this.primaryYAxis = {
           minimum: 0, maximum: 60, interval: 10
        };
       this.marker = { visible: true }
    }

}
import { bootstrapApplication } from '@angular/platform-browser';
import { AppComponent } from './app.component';
bootstrapApplication(AppComponent).catch((err) => console.error(err));Segment stripline
You can restrict a stripline to a particular region of the chart with respect to a segment defined on a different axis. Use isSegmented to enable this feature, and segmentStart and segmentEnd to define the range.
-
isSegmented- Enables the segment stripline. -
segmentStart- Sets the segment start value. The value corresponds to the associated axis. -
segmentEnd- Sets the segment end value. The value corresponds to the associated axis. -
segmentAxisName- Specifies the name of the associated axis. Required when the chart contains multiple axes and the default axis cannot be unambiguously resolved.
import { ChartModule } from '@syncfusion/ej2-angular-charts'
import { StripLineService, ColumnSeriesService, DataLabelService, LineSeriesService } from '@syncfusion/ej2-angular-charts'
import { Component, OnInit } from '@angular/core';
import { stripData } from './datasource';

@Component({
imports: [
         ChartModule
    ],

providers: [ StripLineService, ColumnSeriesService, DataLabelService, LineSeriesService ],
standalone: true,
    selector: 'app-container',
    template: `<ejs-chart id="chart-container" [primaryYAxis]='primaryYAxis'>
        <e-series-collection>
            <e-series [dataSource]='chartData' type='Line' xName='x' yName='y' [marker]='marker'></e-series>>
        </e-series-collection>
    </ejs-chart>`
})
export class AppComponent implements OnInit {
    public primaryXAxis?: Object;
    public chartData?: Object[];
    public primaryYAxis?: Object;
    public marker?: Object;
    ngOnInit(): void {
        this.chartData = [
            {x: 1, y: 5},{x: 2, y: 39},{x: 3, y: 21},{x: 4, y: 51},{x: 5, y: 30},
            {x: 6, y: 25},{x: 7, y: 10},{x: 8, y: 40},{x: 9, y: 50},{x: 10, y: 20}
            ];
        this.primaryYAxis = {
        stripLines:[
            {start: 20, end: 40, isSegmented: true, segmentStart: 2, segmentEnd: 4,
            color: 'rgba(167,169,171, 0.3)'}
        ]

        };
        this.marker = { visible: true }
    }

}
import { bootstrapApplication } from '@angular/platform-browser';
import { AppComponent } from './app.component';
bootstrapApplication(AppComponent).catch((err) => console.error(err));See Also
Troubleshooting
If your strip lines do not appear in the chart:
- Ensure
StriplineServiceis registered in the component’sprovidersarray. - Confirm you use the property name
stripLines(plural) on the axis, notstripline(singular). - Ensure the host workspace’s
package.jsonincludes@syncfusion/ej2-angular-charts.
For compatibility information and version-specific notes, refer to the Syncfusion Angular Charts release notes.