Legend in Angular Chart
31 Aug 202624 minutes to read
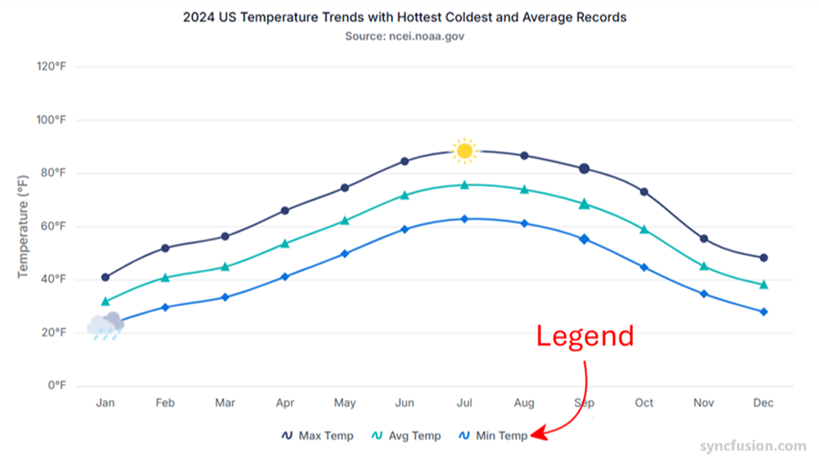
The legend provides information about the series rendered in the chart and helps users identify each series by its color, shape, or style.
To get started quickly with legends in Angular Charts, refer to the following video:
Note: To use the legend feature, inject
LegendServiceinto theprovidersarray of your@NgModule.
Position and alignment
By using the position property, the legend can be positioned at the left, right, top, or bottom of the chart. By default, the legend is positioned at the bottom of the chart.
import { ChartModule } from '@syncfusion/ej2-angular-charts'
import { CategoryService, BarSeriesService, ColumnSeriesService, LineSeriesService, LegendService, DataLabelService, MultiLevelLabelService, SelectionService } from '@syncfusion/ej2-angular-charts'
import { Component, OnInit } from '@angular/core';

@Component({
imports: [
         ChartModule
    ],

providers: [ CategoryService, BarSeriesService, ColumnSeriesService, LineSeriesService,LegendService, DataLabelService, MultiLevelLabelService, SelectionService],
standalone: true,
    selector: 'app-container',
    template: `<ejs-chart id="chart-container" [primaryXAxis]='primaryXAxis'[primaryYAxis]='primaryYAxis' [title]='title' [legendSettings]='legendSettings'>
        <e-series-collection>
            <e-series [dataSource]='chartData' type='Column' xName='country' yName='gold' name='Gold' ></e-series>
            <e-series [dataSource]='chartData' type='Column' xName='country' yName='silver' name='Silver'></e-series>
            <e-series [dataSource]='chartData' type='Column' xName='country' yName='bronze' name='Bronze' ></e-series>
        </e-series-collection>
    </ejs-chart>`
})
export class AppComponent implements OnInit {
    public primaryXAxis?: Object;
    public chartData?: Object[];
    public title?: string;
    public primaryYAxis?: Object;
    public legendSettings?: Object;
    ngOnInit(): void {
        this.chartData = [
                { country: "USA", gold: 50, silver: 70, bronze: 45 },
                { country: "China", gold: 40, silver: 60, bronze: 55 },
                { country: "Japan", gold: 70, silver: 60, bronze: 50 },
                { country: "Australia", gold: 60, silver: 56, bronze: 40 },
                { country: "France", gold: 50, silver: 45, bronze: 35 },
                { country: "Germany", gold: 40, silver: 30, bronze: 22 },
                { country: "Italy", gold: 40, silver: 35, bronze: 37 },
                { country: "Sweden", gold: 30, silver: 25, bronze: 27 }
        ];
        this.primaryXAxis = {
           valueType: 'Category',
           title: 'Countries'
        };
        this.primaryYAxis = {
           minimum: 0, maximum: 80,
           interval: 20, title: 'Medals',
        };
        this.legendSettings = { visible: true, position: 'Top' };
        this.title = 'Olympic Medals';
    }

}
import { bootstrapApplication } from '@angular/platform-browser';
import { AppComponent } from './app.component';
bootstrapApplication(AppComponent).catch((err) => console.error(err));Custom positioning allows the legend to be placed anywhere in the chart using x and y coordinates. The values are in pixels, measured from the top-left of the chart area.
import { ChartModule } from '@syncfusion/ej2-angular-charts'
import { CategoryService, BarSeriesService, ColumnSeriesService, LineSeriesService, LegendService, DataLabelService, MultiLevelLabelService, SelectionService } from '@syncfusion/ej2-angular-charts'
import { Component, OnInit } from '@angular/core';

@Component({
imports: [
         ChartModule
    ],

providers: [ CategoryService, BarSeriesService, ColumnSeriesService, LineSeriesService,LegendService, DataLabelService, MultiLevelLabelService, SelectionService],
standalone: true,
    selector: 'app-container',
    template: `<ejs-chart id="chart-container" [primaryXAxis]='primaryXAxis'[primaryYAxis]='primaryYAxis' [title]='title' [legendSettings]='legendSettings'>
        <e-series-collection>
            <e-series [dataSource]='chartData' type='Column' xName='country' yName='gold' name='Gold' ></e-series>
            <e-series [dataSource]='chartData' type='Column' xName='country' yName='silver' name='Silver'></e-series>
            <e-series [dataSource]='chartData' type='Column' xName='country' yName='bronze' name='Bronze' ></e-series>
        </e-series-collection>
    </ejs-chart>`
})
export class AppComponent implements OnInit {
    public primaryXAxis?: Object;
    public chartData?: Object[];
    public title?: string;
    public primaryYAxis?: Object;
    public legendSettings?: Object;
    ngOnInit(): void {
        this.chartData = [
                { country: "USA", gold: 50, silver: 70, bronze: 45 },
                { country: "China", gold: 40, silver: 60, bronze: 55 },
                { country: "Japan", gold: 70, silver: 60, bronze: 50 },
                { country: "Australia", gold: 60, silver: 56, bronze: 40 },
                { country: "France", gold: 50, silver: 45, bronze: 35 },
                { country: "Germany", gold: 40, silver: 30, bronze: 22 },
                { country: "Italy", gold: 40, silver: 35, bronze: 37 },
                { country: "Sweden", gold: 30, silver: 25, bronze: 27 }
        ];
        this.primaryXAxis = {
           valueType: 'Category',
           title: 'Countries'
        };
        this.primaryYAxis = {
           minimum: 0, maximum: 80,
           interval: 20, title: 'Medals',
        };
        this.legendSettings = {
            visible: true,
            position: 'Top',
            location: { x: 200, y: 40 }
        };
        this.title = 'Olympic Medals';
    }

}
import { bootstrapApplication } from '@angular/platform-browser';
import { AppComponent } from './app.component';
bootstrapApplication(AppComponent).catch((err) => console.error(err));Legend reverse
Use the reverse property to reverse the order of legend items. By default, the first series appears first in the legend.
import { ChartModule } from '@syncfusion/ej2-angular-charts'
import { CategoryService, BarSeriesService, ColumnSeriesService, LineSeriesService, LegendService, DataLabelService, MultiLevelLabelService, SelectionService } from '@syncfusion/ej2-angular-charts'
import { Component, OnInit } from '@angular/core';

@Component({
imports: [
         ChartModule
    ],

providers: [ CategoryService, BarSeriesService, ColumnSeriesService, LineSeriesService,LegendService, DataLabelService, MultiLevelLabelService, SelectionService],
standalone: true,
    selector: 'app-container',
    template: `<ejs-chart id="chart-container" [primaryXAxis]='primaryXAxis'[primaryYAxis]='primaryYAxis' [title]='title' [legendSettings]='legendSettings'>
        <e-series-collection>
            <e-series [dataSource]='chartData' type='Column' xName='country' yName='gold' name='Gold' ></e-series>
            <e-series [dataSource]='chartData' type='Column' xName='country' yName='silver' name='Silver'></e-series>
            <e-series [dataSource]='chartData' type='Column' xName='country' yName='bronze' name='Bronze' ></e-series>
        </e-series-collection>
    </ejs-chart>`
})
export class AppComponent implements OnInit {
    public primaryXAxis?: Object;
    public chartData?: Object[];
    public title?: string;
    public primaryYAxis?: Object;
    public legendSettings?: Object;
    ngOnInit(): void {
        this.chartData = [
                { country: "USA", gold: 50, silver: 70, bronze: 45 },
                { country: "China", gold: 40, silver: 60, bronze: 55 },
                { country: "Japan", gold: 70, silver: 60, bronze: 50 },
                { country: "Australia", gold: 60, silver: 56, bronze: 40 },
                { country: "France", gold: 50, silver: 45, bronze: 35 },
                { country: "Germany", gold: 40, silver: 30, bronze: 22 },
                { country: "Italy", gold: 40, silver: 35, bronze: 37 },
                { country: "Sweden", gold: 30, silver: 25, bronze: 27 }
        ];
        this.primaryXAxis = {
           valueType: 'Category',
           title: 'Countries'
        };
        this.primaryYAxis = {
           minimum: 0, maximum: 80,
           interval: 20, title: 'Medals',
        };
        this.legendSettings = { visible: true, reverse: true };
        this.title = 'Olympic Medals';
    }

}
import { bootstrapApplication } from '@angular/platform-browser';
import { AppComponent } from './app.component';
bootstrapApplication(AppComponent).catch((err) => console.error(err));Legend alignment
Align the legend to center, far, or near using the alignment property.
import { ChartModule } from '@syncfusion/ej2-angular-charts'
import { CategoryService, BarSeriesService, ColumnSeriesService, LineSeriesService, LegendService, DataLabelService, MultiLevelLabelService, SelectionService } from '@syncfusion/ej2-angular-charts'
import { Component, OnInit } from '@angular/core';

@Component({
imports: [
         ChartModule
    ],

providers: [ CategoryService, BarSeriesService, ColumnSeriesService, LineSeriesService,LegendService, DataLabelService, MultiLevelLabelService, SelectionService],
standalone: true,
    selector: 'app-container',
    template: `<ejs-chart id="chart-container" [primaryXAxis]='primaryXAxis'[primaryYAxis]='primaryYAxis' [title]='title' [legendSettings]='legendSettings'>
        <e-series-collection>
            <e-series [dataSource]='chartData' type='Column' xName='country' yName='gold' name='Gold' ></e-series>
            <e-series [dataSource]='chartData' type='Column' xName='country' yName='silver' name='Silver'></e-series>
            <e-series [dataSource]='chartData' type='Column' xName='country' yName='bronze' name='Bronze' ></e-series>
        </e-series-collection>
    </ejs-chart>`
})
export class AppComponent implements OnInit {
    public primaryXAxis?: Object;
    public chartData?: Object[];
    public title?: string;
    public primaryYAxis?: Object;
    public legendSettings?: Object;
    ngOnInit(): void {
        this.chartData = [
                { country: "USA", gold: 50, silver: 70, bronze: 45 },
                { country: "China", gold: 40, silver: 60, bronze: 55 },
                { country: "Japan", gold: 70, silver: 60, bronze: 50 },
                { country: "Australia", gold: 60, silver: 56, bronze: 40 },
                { country: "France", gold: 50, silver: 45, bronze: 35 },
                { country: "Germany", gold: 40, silver: 30, bronze: 22 },
                { country: "Italy", gold: 40, silver: 35, bronze: 37 },
                { country: "Sweden", gold: 30, silver: 25, bronze: 27 }
        ];
        this.primaryXAxis = {
           valueType: 'Category',
           title: 'Countries'
        };
        this.primaryYAxis = {
           minimum: 0, maximum: 80,
           interval: 20, title: 'Medals',
        };
        this.legendSettings = { visible: true, position: 'Top', alignment: 'Near' };
        this.title = 'Olympic Medals';
    }

}
import { bootstrapApplication } from '@angular/platform-browser';
import { AppComponent } from './app.component';
bootstrapApplication(AppComponent).catch((err) => console.error(err));Customization
To change the legend icon shape, use the legendShape property in the series. By default, the legend icon shape is the seriesType.
import { ChartModule } from '@syncfusion/ej2-angular-charts'
import { CategoryService, BarSeriesService, ColumnSeriesService, LineSeriesService, LegendService, DataLabelService, MultiLevelLabelService, SelectionService } from '@syncfusion/ej2-angular-charts'
import { Component, OnInit } from '@angular/core';

@Component({
imports: [
         ChartModule
    ],

providers: [ CategoryService, BarSeriesService, ColumnSeriesService, LineSeriesService,LegendService, DataLabelService, MultiLevelLabelService, SelectionService],
standalone: true,
    selector: 'app-container',
    template: `<ejs-chart id="chart-container" [primaryXAxis]='primaryXAxis'[primaryYAxis]='primaryYAxis' [title]='title' [legendSettings]='legendSettings'>
        <e-series-collection>
            <e-series [dataSource]='chartData' type='Column' xName='country' yName='gold' name='Gold' legendShape='Circle'></e-series>
            <e-series [dataSource]='chartData' type='Column' xName='country' yName='silver' name='Silver' legendShape='SeriesType'></e-series>
            <e-series [dataSource]='chartData' type='Column' xName='country' yName='bronze' name='Bronze' legendShape='Rectangle'></e-series>
        </e-series-collection>
    </ejs-chart>`
})
export class AppComponent implements OnInit {
    public primaryXAxis?: Object;
    public chartData?: Object[];
    public title?: string;
    public primaryYAxis?: Object;
    public legendSettings?: Object;
    ngOnInit(): void {
        this.chartData = [
                { country: "USA", gold: 50, silver: 70, bronze: 45 },
                { country: "China", gold: 40, silver: 60, bronze: 55 },
                { country: "Japan", gold: 70, silver: 60, bronze: 50 },
                { country: "Australia", gold: 60, silver: 56, bronze: 40 },
                { country: "France", gold: 50, silver: 45, bronze: 35 },
                { country: "Germany", gold: 40, silver: 30, bronze: 22 },
                { country: "Italy", gold: 40, silver: 35, bronze: 37 },
                { country: "Sweden", gold: 30, silver: 25, bronze: 27 }
        ];
        this.primaryXAxis = {
           valueType: 'Category',
           title: 'Countries'
        };
        this.primaryYAxis = {
           minimum: 0, maximum: 80,
           interval: 20, title: 'Medals',
        };
        this.legendSettings = { visible: true };
        this.title = 'Olympic Medals';
    }

}
import { bootstrapApplication } from '@angular/platform-browser';
import { AppComponent } from './app.component';
bootstrapApplication(AppComponent).catch((err) => console.error(err));Legend size
By default, the legend occupies approximately 20%–25% of the chart height when positioned at the top or bottom, and 20%–25% of the chart width when positioned at the left or right. Change the default size, in pixels, using the width and height properties of legendSettings.
import { ChartModule } from '@syncfusion/ej2-angular-charts'
import { CategoryService, BarSeriesService, ColumnSeriesService, LineSeriesService, LegendService, DataLabelService, MultiLevelLabelService, SelectionService } from '@syncfusion/ej2-angular-charts'
import { Component, OnInit } from '@angular/core';

@Component({
imports: [
         ChartModule
    ],

providers: [ CategoryService, BarSeriesService, ColumnSeriesService, LineSeriesService,LegendService, DataLabelService, MultiLevelLabelService, SelectionService],
standalone: true,
    selector: 'app-container',
    template: `<ejs-chart id="chart-container" [primaryXAxis]='primaryXAxis'[primaryYAxis]='primaryYAxis' [title]='title' [legendSettings]='legendSettings'>
        <e-series-collection>
            <e-series [dataSource]='chartData' type='Column' xName='country' yName='gold' name='Gold' legendShape='Circle'></e-series>
            <e-series [dataSource]='chartData' type='Column' xName='country' yName='silver' name='Silver' legendShape='Circle'></e-series>
            <e-series [dataSource]='chartData' type='Column' xName='country' yName='bronze' name='Bronze' legendShape='Circle'></e-series>
        </e-series-collection>
    </ejs-chart>`
})
export class AppComponent implements OnInit {
    public primaryXAxis?: Object;
    public chartData?: Object[];
    public title?: string;
    public primaryYAxis?: Object;
    public legendSettings?: Object;
    ngOnInit(): void {
        this.chartData = [
                { country: "USA", gold: 50, silver: 70, bronze: 45 },
                { country: "China", gold: 40, silver: 60, bronze: 55 },
                { country: "Japan", gold: 70, silver: 60, bronze: 50 },
                { country: "Australia", gold: 60, silver: 56, bronze: 40 },
                { country: "France", gold: 50, silver: 45, bronze: 35 },
                { country: "Germany", gold: 40, silver: 30, bronze: 22 },
                { country: "Italy", gold: 40, silver: 35, bronze: 37 },
                { country: "Sweden", gold: 30, silver: 25, bronze: 27 }
        ];
        this.primaryXAxis = {
           valueType: 'Category',
           title: 'Countries'
        };
        this.primaryYAxis = {
           minimum: 0, maximum: 80,
           interval: 20, title: 'Medals',
        };
        this.legendSettings = { visible: true, height: '100', width: '500' };
        this.title = 'Olympic Medals';
    }

}
import { bootstrapApplication } from '@angular/platform-browser';
import { AppComponent } from './app.component';
bootstrapApplication(AppComponent).catch((err) => console.error(err));Legend item size
Customize the size of legend items, in pixels, using the shapeHeight and shapeWidth properties.
import { ChartModule } from '@syncfusion/ej2-angular-charts'
import { CategoryService, BarSeriesService, ColumnSeriesService, LineSeriesService, LegendService, DataLabelService, MultiLevelLabelService, SelectionService } from '@syncfusion/ej2-angular-charts'
import { Component, OnInit } from '@angular/core';

@Component({
imports: [
         ChartModule
    ],

providers: [ CategoryService, BarSeriesService, ColumnSeriesService, LineSeriesService,LegendService, DataLabelService, MultiLevelLabelService, SelectionService],
standalone: true,
    selector: 'app-container',
    template: `<ejs-chart id="chart-container" [primaryXAxis]='primaryXAxis'[primaryYAxis]='primaryYAxis' [title]='title' [legendSettings]='legendSettings'>
        <e-series-collection>
            <e-series [dataSource]='chartData' type='Column' xName='country' yName='gold' name='Gold' legendShape='Rectangle'></e-series>
            <e-series [dataSource]='chartData' type='Column' xName='country' yName='silver' name='Silver' legendShape='Rectangle'></e-series>
            <e-series [dataSource]='chartData' type='Column' xName='country' yName='bronze' name='Bronze' legendShape='Rectangle'></e-series>
        </e-series-collection>
    </ejs-chart>`
})
export class AppComponent implements OnInit {
    public primaryXAxis?: Object;
    public chartData?: Object[];
    public title?: string;
    public primaryYAxis?: Object;
    public legendSettings?: Object;
    ngOnInit(): void {
        this.chartData = [
                { country: "USA", gold: 50, silver: 70, bronze: 45 },
                { country: "China", gold: 40, silver: 60, bronze: 55 },
                { country: "Japan", gold: 70, silver: 60, bronze: 50 },
                { country: "Australia", gold: 60, silver: 56, bronze: 40 },
                { country: "France", gold: 50, silver: 45, bronze: 35 },
                { country: "Germany", gold: 40, silver: 30, bronze: 22 },
                { country: "Italy", gold: 40, silver: 35, bronze: 37 },
                { country: "Sweden", gold: 30, silver: 25, bronze: 27 }
        ];
        this.primaryXAxis = {
           valueType: 'Category',
           title: 'Countries'
        };
        this.primaryYAxis = {
           minimum: 0, maximum: 80,
           interval: 20, title: 'Medals',
        };
        this.legendSettings = { visible: true, shapeHeight: 15, shapeWidth: 15 };
        this.title = 'Olympic Medals';
    }

}
import { bootstrapApplication } from '@angular/platform-browser';
import { AppComponent } from './app.component';
bootstrapApplication(AppComponent).catch((err) => console.error(err));Paging for legend
Paging is enabled automatically when legend items exceed the legend bounds. Navigate between pages using the provided navigation buttons.
import { ChartModule } from '@syncfusion/ej2-angular-charts'
import { CategoryService, LineSeriesService, LegendService } from '@syncfusion/ej2-angular-charts'
import { Component, OnInit } from '@angular/core';

@Component({
imports: [
         ChartModule
    ],

providers: [ CategoryService, LineSeriesService, LegendService ],
standalone: true,
    selector: 'app-container',
    template: `<ejs-chart id="chart-container" [primaryXAxis]='primaryXAxis'[primaryYAxis]='primaryYAxis' [legendSettings]='legendSettings' [title]='title'>
        <e-series-collection>
            <e-series [dataSource]='chartData' type='Line' xName='x' yName='y' name='December 2007' width=2 [marker]='marker'></e-series>
            <e-series [dataSource]='chartData' type='Line' xName='x' yName='y1' name='December 2008' width=2 [marker]='marker1'></e-series>
            <e-series [dataSource]='chartData' type='Line' xName='x' yName='y2' name='December 2009' width=2 [marker]='marker2'></e-series>
            <e-series [dataSource]='chartData' type='Line' xName='x' yName='y3' name='December 2010' width=2 [marker]='marker3'></e-series>
        </e-series-collection>
    </ejs-chart>`
})
export class AppComponent implements OnInit {
    public primaryXAxis?: Object;
    public chartData?: Object[];
    public title?: string;
    public primaryYAxis?: Object;
    public marker?: Object;
    public marker1?: Object;
    public marker2?: Object;
    public marker3?: Object;
    public legendSettings?: Object;
    ngOnInit(): void {
        this.chartData = [
              { x: 'WW', y: 12, y1: 22, y2: 38.3, y3: 50 },
              { x: 'EU', y: 9.9, y1: 26, y2: 45.2, y3: 63.6 },
              { x: 'APAC', y: 4.4, y1: 9.3, y2: 18.2, y3: 20.9 },
              { x: 'LATAM', y: 6.4, y1: 28, y2: 46.7, y3: 65.1 },
              { x: 'MEA', y: 30, y1: 45.7, y2: 61.5, y3: 73 },
              { x: 'NA', y: 25.3, y1: 35.9, y2: 64, y3: 81.4 }
        ];
        this.primaryXAxis = {
            title: 'Countries',
            valueType: 'Category', interval: 1,
            labelIntersectAction : 'Rotate45'
        };
        this.primaryYAxis = {
            title: 'Penetration (%)',
            rangePadding: 'None', labelFormat: '{value}%',
            minimum: 0, maximum: 90
        };
        this.marker = { visible: true, width: 10, height: 10, shape: 'Diamond' };
        this.marker1 = { visible: true, width: 10, height: 10, shape: 'Pentagon' };
        this.marker2 = { visible: true, width: 10, height: 10, shape: 'Triangle' };
        this.marker3 = { visible: true, width: 10, height: 10, shape: 'Circle' };
        this.title = 'FB Penetration of Internet Audience';
        this.legendSettings = {
            padding: 10, shapePadding: 10,
            visible: true, border: {
                width: 2, color: 'grey'
            },
            width: '200'
        };
    }

}
import { bootstrapApplication } from '@angular/platform-browser';
import { AppComponent } from './app.component';
bootstrapApplication(AppComponent).catch((err) => console.error(err));Legend text wrap
When legend text exceeds the container, enable wrapping using the textWrap property. Wrapping can also be controlled using the maximumLabelWidth property; the default value is 61 pixels.
import { ChartModule } from '@syncfusion/ej2-angular-charts'
import { CategoryService, BarSeriesService, ColumnSeriesService, LineSeriesService, LegendService, DataLabelService, MultiLevelLabelService, SelectionService } from '@syncfusion/ej2-angular-charts'
import { Component, OnInit } from '@angular/core';

@Component({
imports: [
         ChartModule
    ],

providers: [ CategoryService, BarSeriesService, ColumnSeriesService, LineSeriesService,LegendService, DataLabelService, MultiLevelLabelService, SelectionService],
standalone: true,
    selector: 'app-container',
    template: `<ejs-chart id="chart-container" [primaryXAxis]='primaryXAxis'[primaryYAxis]='primaryYAxis' [title]='title' [legendSettings]='legendSettings'>
        <e-series-collection>
            <e-series [dataSource]='chartData' type='Column' xName='country' yName='gold' name='Gold Medals'></e-series>
            <e-series [dataSource]='chartData' type='Column' xName='country' yName='silver' name='Silver Medals'></e-series>
            <e-series [dataSource]='chartData' type='Column' xName='country' yName='bronze' name='Bronze Medals'></e-series>
        </e-series-collection>
    </ejs-chart>`
})
export class AppComponent implements OnInit {
    public primaryXAxis?: Object;
    public chartData?: Object[];
    public title?: string;
    public primaryYAxis?: Object;
    public legendSettings?: Object;
    ngOnInit(): void {
        this.chartData = [
                { country: "USA", gold: 50, silver: 70, bronze: 45 },
                { country: "China", gold: 40, silver: 60, bronze: 55 },
                { country: "Japan", gold: 70, silver: 60, bronze: 50 },
                { country: "Australia", gold: 60, silver: 56, bronze: 40 },
                { country: "France", gold: 50, silver: 45, bronze: 35 },
                { country: "Germany", gold: 40, silver: 30, bronze: 22 },
                { country: "Italy", gold: 40, silver: 35, bronze: 37 },
                { country: "Sweden", gold: 30, silver: 25, bronze: 27 }
        ];
        this.primaryXAxis = {
           valueType: 'Category',
           title: 'Countries'
        };
        this.primaryYAxis = {
           minimum: 0, maximum: 80,
           interval: 20, title: 'Medals',
        };
        this.legendSettings = { visible: true, position:'Right', textWrap:'Wrap',        maximumLabelWidth:50 };
        this.title = 'Olympic Medals';
    }

}
import { bootstrapApplication } from '@angular/platform-browser';
import { AppComponent } from './app.component';
bootstrapApplication(AppComponent).catch((err) => console.error(err));Set the label color based on series color
Set the legend label color based on the series color by using the chart’s loaded event.
import { ChartModule } from '@syncfusion/ej2-angular-charts'
import { CategoryService, BarSeriesService, ColumnSeriesService, LineSeriesService, LegendService, DataLabelService, MultiLevelLabelService, SelectionService } from '@syncfusion/ej2-angular-charts'
import { Component, OnInit } from '@angular/core';
import { ILoadedEventArgs } from '@syncfusion/ej2-angular-charts';
import { categoryData } from './datasource';

@Component({
imports: [
         ChartModule
    ],

providers: [ CategoryService, BarSeriesService, ColumnSeriesService, LineSeriesService,LegendService, DataLabelService, MultiLevelLabelService, SelectionService],
standalone: true,
    selector: 'app-container',
    template: `<ejs-chart id="charts" [primaryXAxis]='primaryXAxis'[primaryYAxis]='primaryYAxis' [title]='title' [legendSettings]='legendSettings' (loaded)='onChartLoaded($event)' >
        <e-series-collection>
            <e-series [dataSource]='chartData' type='Column' xName='country' yName='gold' name='Gold' ></e-series>
            <e-series [dataSource]='chartData' type='Column' xName='country' yName='silver' name='Silver'></e-series>
            <e-series [dataSource]='chartData' type='Column' xName='country' yName='bronze' name='Bronze' ></e-series>
        </e-series-collection>
    </ejs-chart>`
})

// declare the series colors

export class AppComponent implements OnInit {
    public color: string[] = ['#00BDAE', '#404041', '#357CD2'];
    public primaryXAxis?: Object;
    public chartData?: Object[];
    public title?: string;
    public primaryYAxis?: Object;
    public legendSettings?: Object;
    ngOnInit(): void {
        this.chartData = categoryData;
        this.primaryXAxis = {
           valueType: 'Category',
           title: 'Countries'
        };
        this.primaryYAxis = {
           minimum: 0, maximum: 80,
           interval: 20, title: 'Medals',
        };
        this.legendSettings = { visible: true, position: 'Top' };
        this.title = 'Olympic Medals';
    }
    public onChartLoaded(args: ILoadedEventArgs): void {
      let legendTextCol: any = document.querySelectorAll('[id*="charts_chart_legend_text_"]');
      for (let i = 0; i < legendTextCol.length; i++) {
          //set the color to legend label
          legendTextCol[i].setAttribute('fill', this.color[i]);
      }
  }

}
import { bootstrapApplication } from '@angular/platform-browser';
import { AppComponent } from './app.component';
bootstrapApplication(AppComponent).catch((err) => console.error(err));Series selection on legend
By default, clicking a legend item toggles the visibility of its series. To select a series through a legend click, disable toggleVisibility.
import { ChartModule } from '@syncfusion/ej2-angular-charts'
import { CategoryService, BarSeriesService, ColumnSeriesService, LineSeriesService, LegendService, DataLabelService, MultiLevelLabelService, SelectionService } from '@syncfusion/ej2-angular-charts'
import { Component, OnInit } from '@angular/core';

@Component({
imports: [
         ChartModule
    ],

providers: [ CategoryService, BarSeriesService, ColumnSeriesService, LineSeriesService,LegendService, DataLabelService, MultiLevelLabelService, SelectionService],
standalone: true,
    selector: 'app-container',
    template: `<ejs-chart id="chart-container" [primaryXAxis]='primaryXAxis'[primaryYAxis]='primaryYAxis' [title]='title' [legendSettings]='legendSettings' selectionMode='Point'>
        <e-series-collection>
            <e-series [dataSource]='chartData' type='Column' xName='country' yName='gold' name='Gold' legendShape='Circle'></e-series>
            <e-series [dataSource]='chartData' type='Column' xName='country' yName='silver' name='Silver' legendShape='Circle'></e-series>
            <e-series [dataSource]='chartData' type='Column' xName='country' yName='bronze' name='Bronze' legendShape='Circle'></e-series>
        </e-series-collection>
    </ejs-chart>`
})
export class AppComponent implements OnInit {
    public primaryXAxis?: Object;
    public chartData?: Object[];
    public title?: string;
    public primaryYAxis?: Object;
    public legendSettings?: Object;
    ngOnInit(): void {
        this.chartData = [
                { country: "USA", gold: 50, silver: 70, bronze: 45 },
                { country: "China", gold: 40, silver: 60, bronze: 55 },
                { country: "Japan", gold: 70, silver: 60, bronze: 50 },
                { country: "Australia", gold: 60, silver: 56, bronze: 40 },
                { country: "France", gold: 50, silver: 45, bronze: 35 },
                { country: "Germany", gold: 40, silver: 30, bronze: 22 },
                { country: "Italy", gold: 40, silver: 35, bronze: 37 },
                { country: "Sweden", gold: 30, silver: 25, bronze: 27 }
        ];
        this.primaryXAxis = {
           valueType: 'Category',
           title: 'Countries'
        };
        this.primaryYAxis = {
           minimum: 0, maximum: 80,
           interval: 20, title: 'Medals',
        };
        this.legendSettings = { visible: true, toggleVisibility: false };
        this.title = 'Olympic Medals';
    }

}
import { bootstrapApplication } from '@angular/platform-browser';
import { AppComponent } from './app.component';
bootstrapApplication(AppComponent).catch((err) => console.error(err));Enable animation
Show or hide the series with animation when clicking a legend item by setting the enableAnimation property to true or false. This property only applies when toggleVisibility is enabled. The default value is true.
import { ChartModule } from '@syncfusion/ej2-angular-charts'
import { CategoryService, BarSeriesService, ColumnSeriesService, LineSeriesService, LegendService, DataLabelService, MultiLevelLabelService, SelectionService } from '@syncfusion/ej2-angular-charts'
import { Component, OnInit } from '@angular/core';

@Component({
imports: [
         ChartModule
    ],

providers: [ CategoryService, BarSeriesService, ColumnSeriesService, LineSeriesService,LegendService, DataLabelService, MultiLevelLabelService, SelectionService],
standalone: true,
    selector: 'app-container',
    template: `<ejs-chart id="chart-container" [primaryXAxis]='primaryXAxis'[primaryYAxis]='primaryYAxis' [title]='title' [legendSettings]='legendSettings' [enableAnimation]='enableAnimation'>
        <e-series-collection>
            <e-series [dataSource]='chartData1' type='Column' xName='x' yName='y' name='Gold' [marker]='marker'></e-series>
            <e-series [dataSource]='chartData2' type='Column' xName='x' yName='y' name='Silver' [marker]='marker'></e-series>
            <e-series [dataSource]='chartData3' type='Column' xName='x' yName='y' name='Bronze' [marker]='marker'></e-series>
        </e-series-collection>
    </ejs-chart>`
})
export class AppComponent implements OnInit {
    public primaryXAxis?: Object;
    public chartData1?: Object[];
    public chartData2?: Object[];
    public chartData3?: Object[];
    public title?: string;
    public primaryYAxis?: Object;
    public legendSettings?: Object;
    public marker?: Object;
    public enableAnimation: boolean = true;
    ngOnInit(): void {
        this.chartData1 =  [{ x: 'USA', y: 46 }, { x: 'GBR', y: 27 }, { x: 'CHN', y: 26 }];
        this.chartData2 =  [{ x: 'USA', y: 37 }, { x: 'GBR', y: 23 }, { x: 'CHN', y: 18 }];
        this.chartData3 =  [{ x: 'USA', y: 38 }, { x: 'GBR', y: 17 }, { x: 'CHN', y: 26 }];
        this.primaryXAxis = {
            valueType: 'Category', interval: 1, majorGridLines: { width: 0 }
        };
        this.primaryYAxis = {
            majorGridLines: { width: 0 },
            majorTickLines: { width: 0 }, lineStyle: { width: 0 }, labelStyle: { color: 'transparent' }
        };
        this.legendSettings = { visible: true };
         this.marker = { dataLabel: { visible: true, position: 'Top', font: { fontWeight: '600', color: '#ffffff' } } };
        this.title = 'Olympic Medal Counts - RIO';
    }

}
import { bootstrapApplication } from '@angular/platform-browser';
import { AppComponent } from './app.component';
bootstrapApplication(AppComponent).catch((err) => console.error(err));Collapse legend item
By default, the series name is displayed as its legend text. To hide the legend entry for a particular series while the series itself remains visible in the chart, set that series’ name to an empty string.
import { ChartModule } from '@syncfusion/ej2-angular-charts'
import { CategoryService, BarSeriesService, ColumnSeriesService, LineSeriesService, LegendService, DataLabelService, MultiLevelLabelService, SelectionService } from '@syncfusion/ej2-angular-charts'
import { Component, OnInit } from '@angular/core';

@Component({
imports: [
         ChartModule
    ],

providers: [ CategoryService, BarSeriesService, ColumnSeriesService, LineSeriesService,LegendService, DataLabelService, MultiLevelLabelService, SelectionService],
standalone: true,
    selector: 'app-container',
    template: `<ejs-chart id="chart-container" [primaryXAxis]='primaryXAxis'[primaryYAxis]='primaryYAxis' [title]='title' [legendSettings]='legendSettings'>
        <e-series-collection>
            <e-series [dataSource]='chartData' type='Column' xName='country' yName='gold' name='Gold' legendShape='Circle'></e-series>
            <e-series [dataSource]='chartData' type='Column' xName='country' yName='silver' legendShape='Circle'></e-series>
            <e-series [dataSource]='chartData' type='Column' xName='country' yName='bronze' name='Bronze' legendShape='Circle'></e-series>
        </e-series-collection>
    </ejs-chart>`
})
export class AppComponent implements OnInit {
    public primaryXAxis?: Object;
    public chartData?: Object[];
    public title?: string;
    public primaryYAxis?: Object;
    public legendSettings?: Object;
    ngOnInit(): void {
        this.chartData = [
                { country: "USA", gold: 50, silver: 70, bronze: 45 },
                { country: "China", gold: 40, silver: 60, bronze: 55 },
                { country: "Japan", gold: 70, silver: 60, bronze: 50 },
                { country: "Australia", gold: 60, silver: 56, bronze: 40 },
                { country: "France", gold: 50, silver: 45, bronze: 35 },
                { country: "Germany", gold: 40, silver: 30, bronze: 22 },
                { country: "Italy", gold: 40, silver: 35, bronze: 37 },
                { country: "Sweden", gold: 30, silver: 25, bronze: 27 }
        ];
        this.primaryXAxis = {
           valueType: 'Category',
           title: 'Countries'
        };
        this.primaryYAxis = {
           minimum: 0, maximum: 80,
           interval: 20, title: 'Medals',
        };
        this.legendSettings = { visible: true, toggleVisibility: true };
        this.title = 'Olympic Medals';
    }

}
import { bootstrapApplication } from '@angular/platform-browser';
import { AppComponent } from './app.component';
bootstrapApplication(AppComponent).catch((err) => console.error(err));Legend title
You can set title for legend using title property in legendSettings. You can also customize the fontStyle, size, fontWeight, color, textAlignment, fontFamily, opacity and textOverflow of legend title. titlePosition is used to set the legend position in Top, Left and Right position. maximumTitleWidth is used to set the width of the legend title. By default, it will be 100px.
import { ChartModule } from '@syncfusion/ej2-angular-charts'
import { CategoryService, BarSeriesService, ColumnSeriesService, LineSeriesService, LegendService, DataLabelService, MultiLevelLabelService, SelectionService } from '@syncfusion/ej2-angular-charts'
import { Component, OnInit } from '@angular/core';

@Component({
imports: [
         ChartModule
    ],

providers: [ CategoryService, BarSeriesService, ColumnSeriesService, LineSeriesService,LegendService, DataLabelService, MultiLevelLabelService, SelectionService],
standalone: true,
    selector: 'app-container',
    template: `<ejs-chart id="chart-container" [primaryXAxis]='primaryXAxis'[primaryYAxis]='primaryYAxis' [title]='title' [legendSettings]='legendSettings' selectionMode='Point'>
        <e-series-collection>
            <e-series [dataSource]='chartData' type='Column' xName='country' yName='gold' name='Gold' legendShape='Circle'></e-series>
            <e-series [dataSource]='chartData' type='Column' xName='country' yName='silver' name='Silver' legendShape='Circle'></e-series>
            <e-series [dataSource]='chartData' type='Column' xName='country' yName='bronze' name='Bronze' legendShape='Circle'></e-series>
        </e-series-collection>
    </ejs-chart>`
})
export class AppComponent implements OnInit {
    public primaryXAxis?: Object;
    public chartData?: Object[];
    public title?: string;
    public primaryYAxis?: Object;
    public legendSettings?: Object;
    ngOnInit(): void {
        this.chartData = [
                { country: "USA", gold: 50, silver: 70, bronze: 45 },
                { country: "China", gold: 40, silver: 60, bronze: 55 },
                { country: "Japan", gold: 70, silver: 60, bronze: 50 },
                { country: "Australia", gold: 60, silver: 56, bronze: 40 },
                { country: "France", gold: 50, silver: 45, bronze: 35 },
                { country: "Germany", gold: 40, silver: 30, bronze: 22 },
                { country: "Italy", gold: 40, silver: 35, bronze: 37 },
                { country: "Sweden", gold: 30, silver: 25, bronze: 27 }
        ];
        this.primaryXAxis = {
           valueType: 'Category',
        };
        this.primaryYAxis = {
           minimum: 0, maximum: 80,
           interval: 20, title: 'Medals',
        };
        this.legendSettings = { visible: true, title: 'Countries' };
        this.title = 'Olympic Medals';
    }

}
import { bootstrapApplication } from '@angular/platform-browser';
import { AppComponent } from './app.component';
bootstrapApplication(AppComponent).catch((err) => console.error(err));Arrow page navigation
By default, page numbers are visible during legend paging. Set enablePages to false to hide the page numbers and display left and right arrow navigation instead.
import { ChartModule } from '@syncfusion/ej2-angular-charts'
import { CategoryService, BarSeriesService, ColumnSeriesService, LineSeriesService, LegendService, DataLabelService, MultiLevelLabelService, SelectionService } from '@syncfusion/ej2-angular-charts'
import { Component, OnInit } from '@angular/core';

@Component({
imports: [
         ChartModule
    ],

providers: [ CategoryService, BarSeriesService, ColumnSeriesService, LineSeriesService,LegendService, DataLabelService, MultiLevelLabelService, SelectionService],
standalone: true,
    selector: 'app-container',
    template: `<ejs-chart id="chart-container" [primaryXAxis]='primaryXAxis'[primaryYAxis]='primaryYAxis' [title]='title' [legendSettings]='legendSettings'>
        <e-series-collection>
            <e-series [dataSource]='chartData' [marker]='marker' type='Line' name='December 2007' xName='x' yName='y'></e-series>
            <e-series [dataSource]='chartData' [marker]='marker' type='Line' name='December 2008' xName='x' yName='y1'></e-series>
            <e-series [dataSource]='chartData' [marker]='marker' type='Line' name='December 2009' xName='x' yName='y2'></e-series>
            <e-series [dataSource]='chartData' [marker]='marker' type='Line' name='December 2010' xName='x' yName='y3'></e-series>
        </e-series-collection>
    </ejs-chart>`
})
export class AppComponent implements OnInit {
    public primaryXAxis?: Object;
    public chartData?: Object[];
    public title?: string;
    public primaryYAxis?: Object;
    public legendSettings?: Object;
    public marker?: Object;
    ngOnInit(): void {
        this.chartData = [
    { x: 'WW', y: 12, y1: 22, y2: 38.3, y3: 50 },
    { x: 'EU', y: 9.9, y1: 26, y2: 45.2, y3: 63.6 },
    { x: 'APAC', y: 4.4, y1: 9.3, y2: 18.2, y3: 20.9 },
    { x: 'LATAM', y: 6.4, y1: 28, y2: 46.7, y3: 65.1 },
    { x: 'MEA', y: 30, y1: 45.7, y2: 61.5, y3: 73 },
    { x: 'NA', y: 25.3, y1: 35.9, y2: 64, y3: 81.4 }
     ];
        this.primaryXAxis = {
           valueType: 'Category',
        };
        this.primaryYAxis = {
           minimum: 0, maximum: 80,
           interval: 20, title: 'Medals',
        };
        this.legendSettings = { width: '180', enablePages: false };
        this.title = 'Olympic Medals';
        this.marker = {
            visible: true,
            width: 10, height: 10,
            shape: 'Diamond'
        }
    }
}
import { bootstrapApplication } from '@angular/platform-browser';
import { AppComponent } from './app.component';
bootstrapApplication(AppComponent).catch((err) => console.error(err));Legend item padding
The itemPadding property can be used to adjust the space between the legend items.
import { ChartModule } from '@syncfusion/ej2-angular-charts'
import { CategoryService, BarSeriesService, ColumnSeriesService, LineSeriesService, LegendService, DataLabelService, MultiLevelLabelService, SelectionService } from '@syncfusion/ej2-angular-charts'
import { Component, OnInit } from '@angular/core';

@Component({
imports: [
         ChartModule
    ],

providers: [ CategoryService, BarSeriesService, ColumnSeriesService, LineSeriesService,LegendService, DataLabelService, MultiLevelLabelService, SelectionService],
standalone: true,
    selector: 'app-container',
    template: `<ejs-chart id="chart-container" [primaryXAxis]='primaryXAxis'[primaryYAxis]='primaryYAxis' [title]='title' [legendSettings]='legendSettings'>
        <e-series-collection>
            <e-series [dataSource]='chartData' [marker]='marker' type='Line' name='December 2007' xName='x' yName='y'></e-series>
            <e-series [dataSource]='chartData' [marker]='marker' type='Line' name='December 2008' xName='x' yName='y1'></e-series>
            <e-series [dataSource]='chartData' [marker]='marker' type='Line' name='December 2009' xName='x' yName='y2'></e-series>
            <e-series [dataSource]='chartData' [marker]='marker' type='Line' name='December 2010' xName='x' yName='y3'></e-series>
        </e-series-collection>
    </ejs-chart>`
})
export class AppComponent implements OnInit {
    public primaryXAxis?: Object;
    public chartData?: Object[];
    public title?: string;
    public primaryYAxis?: Object;
    public legendSettings?: Object;
    public marker?: Object;
    ngOnInit(): void {
        this.chartData = [
    { x: 'WW', y: 12, y1: 22, y2: 38.3, y3: 50 },
    { x: 'EU', y: 9.9, y1: 26, y2: 45.2, y3: 63.6 },
    { x: 'APAC', y: 4.4, y1: 9.3, y2: 18.2, y3: 20.9 },
    { x: 'LATAM', y: 6.4, y1: 28, y2: 46.7, y3: 65.1 },
    { x: 'MEA', y: 30, y1: 45.7, y2: 61.5, y3: 73 },
    { x: 'NA', y: 25.3, y1: 35.9, y2: 64, y3: 81.4 }
     ];
        this.primaryXAxis = {
           valueType: 'Category',
        };
        this.primaryYAxis = {
           minimum: 0, maximum: 80,
           interval: 20, title: 'Medals'};
        this.legendSettings = { enablePages:false , position: "Bottom",
        itemPadding: 30 };
        this.title = 'Olympic Medals';
        this.marker = {
            visible: true,
            width: 10, height: 10,
            shape: 'Diamond'
        }
    }
}
import { bootstrapApplication } from '@angular/platform-browser';
import { AppComponent } from './app.component';
bootstrapApplication(AppComponent).catch((err) => console.error(err));Legend layout
The layout property in legendSettings allows you to display the legend either horizontally or vertically. Available values are "Auto", "Horizontal", and "Vertical"; the default is Auto. The maximumColumns property defines the maximum number of columns that can be displayed within the available space when using the auto layout. Additionally, enabling the fixedWidth property ensures that all legend items are displayed with equal widths. The width of each item is determined by the maximum width among the legend items.
import { ChartModule } from '@syncfusion/ej2-angular-charts';
import { CategoryService, ColumnSeriesService, LegendService } from '@syncfusion/ej2-angular-charts';
import { Component, OnInit } from '@angular/core';
import { chartData } from './datasource';

@Component({
    imports: [ChartModule],
    providers: [CategoryService, ColumnSeriesService, LegendService],
    standalone: true,
    selector: 'app-container',
    template: `<ejs-chart id="chart-container" [primaryXAxis]='primaryXAxis'[primaryYAxis]='primaryYAxis' [title]='title' [legendSettings]='legendSettings'>
        <e-series-collection>
            <e-series [dataSource]='chartData' type='Column' xName='country' yName='gold' name='Gold'></e-series>
            <e-series [dataSource]='chartData' type='Column' xName='country' yName='silver' name='Silver'></e-series>
            <e-series [dataSource]='chartData' type='Column' xName='country' yName='bronze' name='Bronze'></e-series>
            <e-series [dataSource]='chartData' type='Column' xName='country' yName='gold' name='Ruby'></e-series>
            <e-series [dataSource]='chartData' type='Column' xName='country' yName='silver' name='Platinum'></e-series>
            <e-series [dataSource]='chartData' type='Column' xName='country' yName='bronze' name='Diamond'></e-series>
        </e-series-collection>
    </ejs-chart>`
})
export class AppComponent implements OnInit {
    public primaryXAxis?: Object;
    public primaryYAxis?: Object;
    public chartData?: Object[];
    public title?: string;
    public legendSettings?: Object;
    ngOnInit(): void {
        this.chartData = chartData;
        this.primaryXAxis = {
            valueType: 'Category',
            title: 'Countries'
        };
        this.primaryYAxis = {
            minimum: 0, maximum: 80,
            interval: 20, title: 'Medals'
        };
        this.legendSettings = {
            visible: true,
            layout: "Auto",
            maximumColumns: 3,
            fixedWidth: true
        };
        this.title = 'Olympic Medals';
    }

}
import { bootstrapApplication } from '@angular/platform-browser';
import { AppComponent } from './app.component';
bootstrapApplication(AppComponent).catch((err) => console.error(err));Legend template
Legend templates allow you to replace the default legend icons and text with custom HTML for each series. This enables branded styles, richer content (icons, multi-line text, badges), improved readability, and localization.
You can customize the legend items by using the template property of legendSettings. Legend interactions (click to toggle series) remain unless toggleVisibility is set to false. Templates work with all legend positions, alignments, and paging.
import { Component, OnInit, ViewChild } from '@angular/core';
import { ChartModule, ChartComponent, CategoryService, ColumnSeriesService, LegendService, TooltipService, DataLabelService } from '@syncfusion/ej2-angular-charts';
import {chinaData,indiaData,indonesiaData} from './datasource';


@Component({
  imports: [ChartModule],
  providers: [CategoryService, ColumnSeriesService, LegendService, TooltipService, DataLabelService],
  standalone: true,
  selector: 'app-container',
  template: `<ejs-chart id="chart-container" #chartRef [primaryXAxis]="primaryXAxis" [primaryYAxis]="primaryYAxis" [chartArea]="chartArea" [title]="title" [legendSettings]="legendSettings" (legendRender)="legendRender($event)">
        <e-series-collection>
            <e-series [dataSource]="chinaData" type="Column" xName="x" yName="y" name="China" [animation]="{enable:false}" [marker]="{dataLabel:{visible:true}}"></e-series>
            <e-series [dataSource]="indiaData" type="Column" xName="x" yName="y" name="India" [animation]="{enable:false}" [marker]="{dataLabel:{visible:true}}"></e-series>
            <e-series [dataSource]="indonesiaData" type="Column" xName="x" yName="y" name="Indonesia" [animation]="{enable:false}" [marker]="{dataLabel:{visible:true}}"></e-series>
        </e-series-collection>
    </ejs-chart>`
})
export class AppComponent implements OnInit {
    @ViewChild('chartRef') public chartObj!: ChartComponent;

    public primaryXAxis?: Object;
    public primaryYAxis?: Object;
    public chartArea?: Object;
    public title?: string;
    public legendSettings?: Object;
    public chinaData?:Object;
    public indiaData?:Object;
    public indonesiaData?:Object;
    public legendIcons: { [key: string]: string } = {
      China: 'https://img.icons8.com/color/100/china.png',
      India: 'https://img.icons8.com/color/100/india.png',
      Indonesia: 'https://img.icons8.com/color/100/indonesia.png'
    };
    ngOnInit(): void {
      this.chinaData = chinaData;
      this.indiaData = indiaData;
      this.indonesiaData = indonesiaData;
      this.primaryXAxis = {
        interval: 1,
        edgeLabelPlacement: 'Shift',
        majorGridLines: { width: 0 }
      };

      this.primaryYAxis = {
        title: 'Coal Production (Million Tonnes)',
        labelFormat: '{value}t'
      };

      this.chartArea = { border: { width: 0 } };

      this.legendSettings = {
        visible: true,
        template:
          '<div class="coal-legend-item" style="display:flex;align-items:center;gap:8px;padding:4px 8px;opacity:1;transition:opacity .3s;cursor:pointer;">' +
          '<img class="e-icon" src="" width="24" height="24" style="border-radius:4px;object-fit:cover;" />' +
          '<span class="e-label" style="font-size:13px;font-weight:bold;color:;"></span>' +
          '</div>'
      };

      this.title = 'Top 3 Countries by Coal Production (2022–2024)';
    }

    public legendRender(args: any): void {
      const chart: any = (this.chartObj as any).chart || (this.chartObj as any);
      const matchedSeries = (chart.series || []).filter((s: any) => s.name === args.text)[0];
      const opacity = matchedSeries && matchedSeries.visible === false ? '0.5' : '1';
      args.template = args.template
        .replace('opacity:1;', 'opacity:' + opacity + ';')
        .replace('src=""', 'src="' + (this.legendIcons[args.text] || '') + '"')
        .replace('color:;', 'color:' + args.fill + ';')
        .replace('></span>', '>' + args.text + '</span>');
    }

}
import { bootstrapApplication } from '@angular/platform-browser';
import { AppComponent } from './app.component';
bootstrapApplication(AppComponent).catch((err) => console.error(err));Customize each shape in legend
Use the legendRender event to customize legend item shapes. In the handler, set args.shape to the desired shape for each item.
import { ChartModule, ChartAllModule, AccumulationChartAllModule } from '@syncfusion/ej2-angular-charts'
import { GridModule } from '@syncfusion/ej2-angular-grids'
import { PageService } from '@syncfusion/ej2-angular-grids'
import { AccumulationChartModule } from '@syncfusion/ej2-angular-charts'
import { DialogModule } from '@syncfusion/ej2-angular-popups'
import { PieSeriesService, AccumulationTooltipService, AccumulationDataLabelService } from '@syncfusion/ej2-angular-charts'
import {
    LineSeriesService, DateTimeService, DataLabelService, StackingColumnSeriesService, CategoryService,
    StepAreaSeriesService, SplineSeriesService, ScrollBarService, ChartAnnotationService, LegendService, TooltipService, StripLineService,
    SelectionService, ScatterSeriesService, ZoomService, ColumnSeriesService, AreaSeriesService, RangeAreaSeriesService
} from '@syncfusion/ej2-angular-charts'


import { Component, OnInit } from '@angular/core';
import { ILegendRenderEventArgs } from '@syncfusion/ej2-angular-charts';

@Component({
imports: [
         ChartModule, ChartAllModule, AccumulationChartAllModule, AccumulationChartModule, GridModule, DialogModule
    ],

providers: [LineSeriesService, DateTimeService, ColumnSeriesService, DataLabelService, ZoomService, StackingColumnSeriesService, CategoryService,
        StepAreaSeriesService, SplineSeriesService, ChartAnnotationService, LegendService, TooltipService, StripLineService,
        PieSeriesService, AccumulationTooltipService, ScrollBarService, AccumulationDataLabelService, SelectionService, ScatterSeriesService,
        PageService, AreaSeriesService, RangeAreaSeriesService ],
standalone: true,
    selector: 'app-container',
    template: `<ejs-chart id="chart-container" [primaryXAxis]='primaryXAxis'[primaryYAxis]='primaryYAxis' [title]='title' (legendRender)='legendRender($event)'>
        <e-series-collection>
            <e-series [dataSource]='chartData' type='StepArea' xName='x' yName='y' name='Renewable' width=2 [marker]='marker'></e-series>
             <e-series [dataSource]='chartData1' type='StepArea' xName='x' yName='y' name='Non-Renewable' width=2 [marker]='marker'></e-series>
        </e-series-collection>
    </ejs-chart>`
})
export class AppComponent implements OnInit {
    public primaryXAxis?: Object;
    public chartData?: Object[];
    public chartData1?: Object[];
    public title?: string;
    public primaryYAxis?: Object;
    marker: any;
    public legendRender(args: ILegendRenderEventArgs): void {
    if (args.text === 'Renewable') {
    args.shape = 'Circle';
    } else if (args.text === 'Non-Renewable') {
    args.shape = 'Triangle';
    }
    };
    ngOnInit(): void {
        this.chartData = [{ x: 2000, y: 416 }, { x: 2001, y: 490 }, { x: 2002, y: 470 }, { x: 2003, y: 500 },
                { x: 2004, y: 449 }, { x: 2005, y: 470 }, { x: 2006, y: 437 }, { x: 2007, y: 458 }];
        this.chartData1 = [{ x: 2000, y: 180 }, { x: 2001, y: 240 }, { x: 2002, y: 370 }, { x: 2003, y: 200 },
                { x: 2004, y: 229 }, { x: 2005, y: 210 }, { x: 2006, y: 337 }, { x: 2007, y: 258 }];
        this.primaryXAxis = {
           title: 'Year',
           valueType: 'Double'
        };
        this.primaryYAxis = {
           title:'Production (Billion as kWh)',
        };
        this.title = 'Electricity- Production';
    }

}
import { bootstrapApplication } from '@angular/platform-browser';
import { AppComponent } from './app.component';
bootstrapApplication(AppComponent).catch((err) => console.error(err));