Markers in Angular Chart
31 Aug 202621 minutes to read
Data markers are visual indicators placed at each data point on a series, helping you to clearly identify and highlight individual values in your chart. Markers improve readability and accessibility, especially in line and area charts where data points may otherwise be unclear. You can customize the marker shape, color, size, and appearance to match your design requirements.
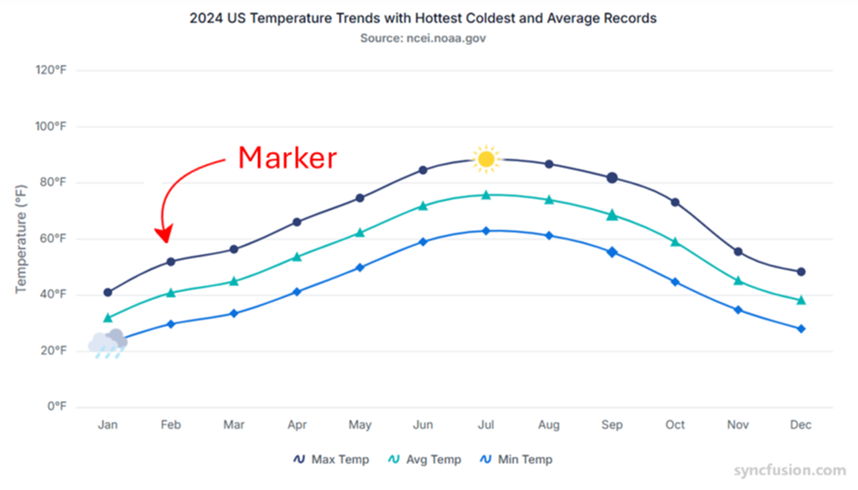
Marker
Enable markers for data points by setting the visible option to true in the marker property. Each series receives a distinct marker shape by default, improving visual differentiation across series.
import { ChartModule } from '@syncfusion/ej2-angular-charts'
import { CategoryService, LineSeriesService } from '@syncfusion/ej2-angular-charts'
import { Component, OnInit } from '@angular/core';
import { markerData } from './datasource';

@Component({
imports: [
         ChartModule
    ],

providers: [ CategoryService, LineSeriesService],
standalone: true,
    selector: 'app-container',
    template: `<ejs-chart id="chart-container" [primaryXAxis]='primaryXAxis'[primaryYAxis]='primaryYAxis' [title]='title'>
        <e-series-collection>
            <e-series [dataSource]='chartData' type='Line' xName='x' yName='y' name='December 2007' width=2 [marker]='marker'></e-series>
            <e-series [dataSource]='chartData' type='Line' xName='x' yName='y1' name='December 2008' width=2 [marker]='marker'></e-series>
        </e-series-collection>
    </ejs-chart>`
})
export class AppComponent implements OnInit {
    public primaryXAxis?: Object;
    public chartData?: Object[];
    public title?: string;
    public marker?: Object;
    primaryYAxis: any;
    ngOnInit(): void {
        this.chartData = markerData;
        this.primaryXAxis = {
            valueType: 'Category', interval: 1,
        };
        this.marker = { visible: true };
        this.title = 'FB Penetration of Internet Audience';
    }

}
import { bootstrapApplication } from '@angular/platform-browser';
import { AppComponent } from './app.component';
bootstrapApplication(AppComponent).catch((err) => console.error(err));Shape
Assign different shapes to markers — such as Rectangle, Circle, Diamond, Triangle, Pentagon, Star, HorizontalLine, VerticalLine, and Cross — using the shape property. Shape selection helps distinguish between multiple series and improves visual clarity.
import { ChartModule } from '@syncfusion/ej2-angular-charts'
import { CategoryService, LineSeriesService } from '@syncfusion/ej2-angular-charts'
import { Component, OnInit } from '@angular/core';
import { markerData } from './datasource';

@Component({
imports: [
         ChartModule
    ],

providers: [ CategoryService, LineSeriesService],
standalone: true,
    selector: 'app-container',
    template: `<ejs-chart id="chart-container" [primaryXAxis]='primaryXAxis'[primaryYAxis]='primaryYAxis' [title]='title'>
        <e-series-collection>
            <e-series [dataSource]='chartData' type='Line' xName='x' yName='y' name='December 2007' width=2 [marker]='marker'></e-series>
        </e-series-collection>
    </ejs-chart>`
})
export class AppComponent implements OnInit {
    public primaryXAxis?: Object;
    public chartData?: Object[];
    public title?: string;
    public marker?: Object;
    primaryYAxis: any;
    ngOnInit(): void {
        this.chartData = markerData;
        this.primaryXAxis = {
            valueType: 'Category'
        };
        this.marker = { visible: true, width: 10, height: 10, shape: 'Diamond' };
        this.title = 'FB Penetration of Internet Audience';
    }

}
import { bootstrapApplication } from '@angular/platform-browser';
import { AppComponent } from './app.component';
bootstrapApplication(AppComponent).catch((err) => console.error(err));Note : To know more about the marker shape types, refer to the
shapeproperty and its supported values.
Images
In addition to built-in shapes, you can also mark each data point with a custom image using the imageUrl property. Provide a URL or relative asset path that resolves to a PNG, JPG, or SVG file. For best results, set width and height on the marker to match the image’s natural dimensions.
import { ChartModule } from '@syncfusion/ej2-angular-charts'
import { CategoryService, LineSeriesService } from '@syncfusion/ej2-angular-charts'
import { Component, OnInit } from '@angular/core';
import { imageData } from './datasource';

@Component({
imports: [
         ChartModule
    ],

providers: [ CategoryService, LineSeriesService],
standalone: true,
    selector: 'app-container',
    template: `<ejs-chart id="chart-container" [primaryXAxis]='primaryXAxis'[primaryYAxis]='primaryYAxis' [title]='title'>
        <e-series-collection>
            <e-series [dataSource]='chartData' type='Line' xName='x' yName='y' name='India' width=2 [marker]='marker'></e-series>
        </e-series-collection>
    </ejs-chart>`
})
export class AppComponent implements OnInit {
    public primaryXAxis?: Object;
    public chartData?: Object[];
    public title?: string;
    public marker?: Object;
    primaryYAxis: any;
    ngOnInit(): void {
        this.chartData = imageData;
        this.primaryXAxis = {
            valueType: 'Category'
        };
        this.marker = { visible: true,
                        width: 10, height: 10, shape: 'Image',
                        imageUrl:'./sun_annotation.png'
        };
        this.title = 'Temperature flow over months';
    }

}
import { bootstrapApplication } from '@angular/platform-browser';
import { AppComponent } from './app.component';
bootstrapApplication(AppComponent).catch((err) => console.error(err));Customization
Marker color, size, and border can be customized using the fill, width, height, and border properties. The width and height set the marker size (not the series line width). The border object accepts width and color keys.
import { ChartModule } from '@syncfusion/ej2-angular-charts'
import { CategoryService, LineSeriesService } from '@syncfusion/ej2-angular-charts'
import { Component, OnInit } from '@angular/core';
import { markerData } from './datasource';

@Component({
imports: [
         ChartModule
    ],

providers: [ CategoryService, LineSeriesService],
standalone: true,
    selector: 'app-container',
    template: `<ejs-chart id="chart-container" [primaryXAxis]='primaryXAxis'[primaryYAxis]='primaryYAxis' [title]='title'>
        <e-series-collection>
            <e-series [dataSource]='chartData' type='Line' xName='x' yName='y' name='December 2007' width=2 [marker]='marker'></e-series>
        </e-series-collection>
    </ejs-chart>`
})
export class AppComponent implements OnInit {
    public primaryXAxis?: Object;
    public chartData?: Object[];
    public title?: string;
    public marker?: Object;
    primaryYAxis: any;
    ngOnInit(): void {
        this.chartData = markerData;
        this.primaryXAxis = {
            valueType: 'Category'
        };
        this.marker = { visible: true,  fill: 'Red', height: 10, width: 10,
                    border:{width: 2, color: 'blue'} };
        this.title = 'FB Penetration of Internet Audience';
    }

}
import { bootstrapApplication } from '@angular/platform-browser';
import { AppComponent } from './app.component';
bootstrapApplication(AppComponent).catch((err) => console.error(err));Customizing specific markers
You can customize individual markers using the pointRender event. Inside the event handler, assign values to args.fill, args.shape, and args.border to override defaults for any data point based on its index or value.
The following example changes the fill, shape, and border for the marker at index 3:
import { ChartModule } from '@syncfusion/ej2-angular-charts'
import { CategoryService, LineSeriesService } from '@syncfusion/ej2-angular-charts'
import { Component, OnInit } from '@angular/core';
import { markerData } from './datasource';
import { IPointRenderEventArgs } from '@syncfusion/ej2-angular-charts';

@Component({
imports: [
         ChartModule
    ],

providers: [ CategoryService, LineSeriesService],
standalone: true,
    selector: 'app-container',
    template: `<ejs-chart id="chart-container" [primaryXAxis]='primaryXAxis'[primaryYAxis]='primaryYAxis' (pointRender)='pointRender($event)' [title]='title'>
        <e-series-collection>
            <e-series [dataSource]='chartData' type='Line' xName='x' yName='y' name='December 2007' width=2 [marker]='marker'></e-series>
        </e-series-collection>
    </ejs-chart>`
})
export class AppComponent implements OnInit {
    public primaryXAxis?: Object;
    public chartData?: Object[];
    public title?: string;
    public marker?: Object;
    primaryYAxis: any;
    public pointRender(args: IPointRenderEventArgs): void {
        if(args.point.index === 3) {
                args.fill = 'red';
                args.shape = 'Diamond';
                args.border = { width: 2, color: 'blue' };
        }
    };
    ngOnInit(): void {
        this.chartData = markerData;
        this.primaryXAxis = {
            valueType: 'Category'
        };
        this.marker = {  visible: true,
                    height: 10, width: 10 };
        this.title = 'FB Penetration of Internet Audience';
    }

}
import { bootstrapApplication } from '@angular/platform-browser';
import { AppComponent } from './app.component';
bootstrapApplication(AppComponent).catch((err) => console.error(err));Assigning different shapes per point
You can also use the pointRender event to dynamically assign a different shape to each data point — useful when you want to vary marker shapes across the series based on the point index or value.
import { ChartModule, ChartAllModule, AccumulationChartAllModule } from '@syncfusion/ej2-angular-charts'
import { GridModule } from '@syncfusion/ej2-angular-grids'
import { PageService } from '@syncfusion/ej2-angular-grids'
import { AccumulationChartModule } from '@syncfusion/ej2-angular-charts'
import { DialogModule } from '@syncfusion/ej2-angular-popups'
import { PieSeriesService, AccumulationTooltipService, AccumulationDataLabelService } from '@syncfusion/ej2-angular-charts'
import {
    LineSeriesService, DateTimeService, DataLabelService, StackingColumnSeriesService, CategoryService,
    StepAreaSeriesService, SplineSeriesService, ScrollBarService, ChartAnnotationService, LegendService, TooltipService, StripLineService,
    SelectionService, ScatterSeriesService, ZoomService, ColumnSeriesService, AreaSeriesService, RangeAreaSeriesService
} from '@syncfusion/ej2-angular-charts'


import { Component, OnInit } from '@angular/core';
import { IPointRenderEventArgs, ChartShape } from '@syncfusion/ej2-angular-charts';

@Component({
imports: [
         ChartModule, ChartAllModule, AccumulationChartAllModule, AccumulationChartModule, GridModule, DialogModule
    ],

providers: [LineSeriesService, DateTimeService, ColumnSeriesService, DataLabelService, ZoomService, StackingColumnSeriesService, CategoryService,
        StepAreaSeriesService, SplineSeriesService, ChartAnnotationService, LegendService, TooltipService, StripLineService,
        PieSeriesService, AccumulationTooltipService, ScrollBarService, AccumulationDataLabelService, SelectionService, ScatterSeriesService,
        PageService, AreaSeriesService, RangeAreaSeriesService ],
standalone: true,
    selector: 'app-container',
    template: `<ejs-chart id="chart-container" [primaryXAxis]='primaryXAxis'[primaryYAxis]='primaryYAxis' [title]='title' (pointRender)='pointRender($event)'>
        <e-series-collection>
            <e-series [dataSource]='chartData' type='Line' xName='x' yName='y' name='India' width=2 [marker]='marker'></e-series>
        </e-series-collection>
    </ejs-chart>`
})
export class AppComponent implements OnInit {
    public primaryXAxis?: Object;
    public chartData?: Object[];
    public title?: string;
    public marker?: Object;
    public primaryYAxis?: Object;
    public shapes: string[] = [
   'Diamond', 'Circle','Rectangle', 'Line', 'Triangle', 'Rectangle'
   ];
    public pointRender(args: IPointRenderEventArgs): void {
       args.shape = <ChartShape>this.shapes[args.point.index];
    };
    ngOnInit(): void {
        this.chartData = [
             { x: new Date(2005, 0, 1), y: 21 }, { x: new Date(2006, 0, 1), y: 24 },
             { x: new Date(2007, 0, 1), y: 30 }, { x: new Date(2008, 0, 1), y: 38 },
                    { x: new Date(2009, 0, 1), y: 54 }, { x: new Date(2010, 0, 1), y: 57 },
        ];
        this.primaryXAxis = {
           title: 'Year',
           valueType: 'DateTime'
        };
        this.primaryYAxis = {
           title: 'Efficiency',
        };
        this.marker = { visible: true, width: 10, height: 10, dataLabel: { visible: true}};
        this.title = 'Inflation - Consumer Price';
    }

}
import { bootstrapApplication } from '@angular/platform-browser';
import { AppComponent } from './app.component';
bootstrapApplication(AppComponent).catch((err) => console.error(err));Fill marker with series color
The marker can be filled with the series color by setting the isFilled property to true. When isFilled is enabled, any explicitly set fill is overridden by the series color.
import { ChartModule } from '@syncfusion/ej2-angular-charts'
import { CategoryService, LineSeriesService } from '@syncfusion/ej2-angular-charts'
import { Component, OnInit } from '@angular/core';
import { markerData } from './datasource';

@Component({
imports: [
         ChartModule
    ],

providers: [ CategoryService, LineSeriesService],
standalone: true,
    selector: 'app-container',
    template: `<ejs-chart id="chart-container" [primaryXAxis]='primaryXAxis'[primaryYAxis]='primaryYAxis' [title]='title'>
        <e-series-collection>
            <e-series [dataSource]='chartData' type='Line' xName='x' yName='y' name='December 2007' width=2 [marker]='marker'></e-series>
        </e-series-collection>
    </ejs-chart>`
})
export class AppComponent implements OnInit {
    public primaryXAxis?: Object;
    public chartData?: Object[];
    public title?: string;
    public marker?: Object;
    primaryYAxis: any;
    ngOnInit(): void {
        this.chartData = markerData;
        this.primaryXAxis = {
            valueType: 'Category'
        };
        this.marker = {  visible: true,
            height: 10, width: 10, isFilled: true };
        this.title = 'FB Penetration of Internet Audience';
    }

}
import { bootstrapApplication } from '@angular/platform-browser';
import { AppComponent } from './app.component';
bootstrapApplication(AppComponent).catch((err) => console.error(err));