What is an Axis in a Chart?
In a chart, an axis refers to the lines that define the boundaries of the chart and provide a scale for measuring data. Charts have two axes: the horizontal axis (x-axis) and the vertical axis (y-axis). Here is the quick overview of axis elements.
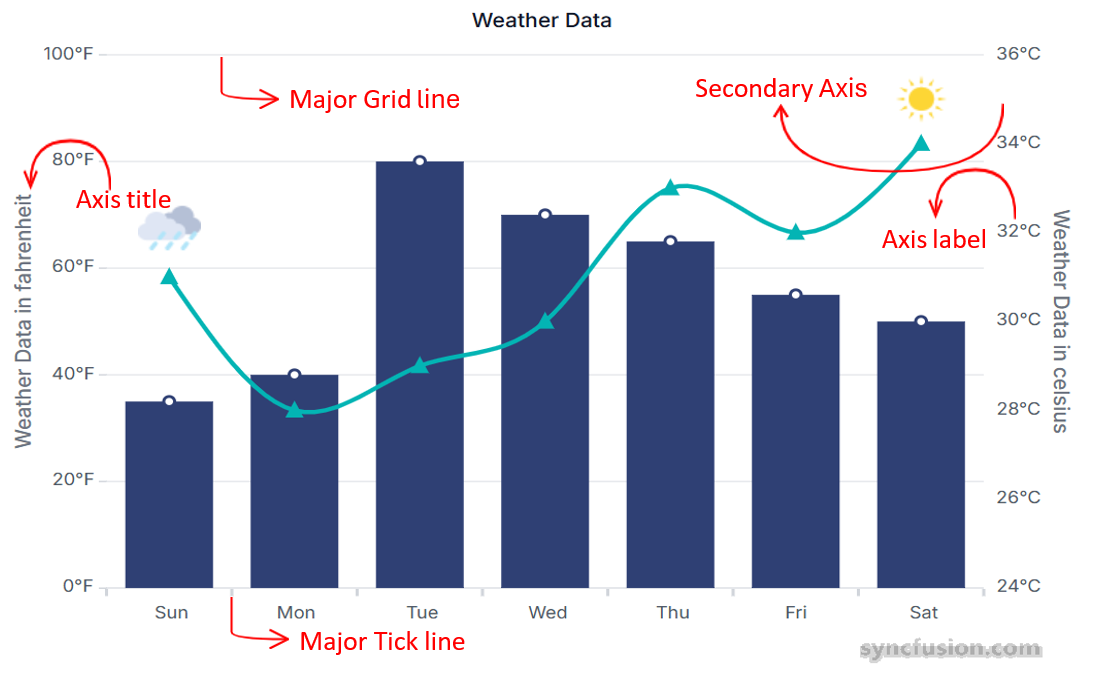
- Grid Lines : Gridlines in charts are horizontal and vertical lines that extend from the axes across the plot area. For more details see Grid Line Customization.
-
Tick Lines : Tick marks are the lines placed along an axis to show the units of measurement. For more details see Tick Line Customization.
-
Secondary Axis: Charts can have multiple axes to show different scales or units. For more details see Secondary Axis.
-
Axis Label: Axis labels are descriptive texts that appear along the axes of a chart, providing essential context about the data being presented. For more details see Axis Label.
-
Axis Title: An axis title in a chart is a descriptive label that indicates the purpose of the chart’s axis. It helps to quickly understand what each axis represents and provides context to the data points. For more details see Title.
-
Axis Types: The
valueType(or equivalent) determines how axis values are interpreted and rendered. For more details see Category Axis, Numeric Axis, DateTime Axis, Logarithmic Axis.