Getting Started with Angular Bullet Chart
11 Aug 20268 minutes to read
This section explains the steps required to create a simple Angular Bullet Chart and demonstrates the basic usage of the Angular Bullet Chart component.
This guide supports Angular 21 and other recent Angular versions. For detailed compatibility with other Angular versions, please refer to the Angular version support matrix. Starting from Angular 19, standalone components are the default, and this guide reflects that architecture.
Ready to streamline your Syncfusion® Angular development? Discover the full potential of Syncfusion® Angular components with Syncfusion® AI Coding Assistant. Effortlessly integrate, configure, and enhance your projects with intelligent, context-aware code suggestions, streamlined setups, and real-time insights—all seamlessly integrated into your preferred AI-powered IDEs like VS Code, Cursor, Syncfusion® CodeStudio and more. Explore Syncfusion® AI Coding Assistant
Prerequisites
Before getting started, ensure that your environment meets the system requirements for Syncfusion® Angular UI components, which covers supported Node.js, Angular, and @syncfusion/ej2-angular-charts versions.
Setup the Angular application
A straightforward approach to begin with Angular is to create a new application using the Angular CLI. Install Angular CLI globally with the following command:
npm install -g @angular/cliVerify the installation:
ng versionAngular 21 Standalone Architecture: Standalone components are the default in Angular 21. This guide uses the modern standalone architecture. If you need more information about the standalone architecture, refer to the Standalone Guide.
Installing a specific version
To install a particular version of Angular CLI, use:
npm install -g @angular/[email protected]Create a new application
With Angular CLI installed, execute this command to generate a new application:
ng new syncfusion-angular-app- This command will prompt you to configure settings like enabling Angular routing and choosing a stylesheet format.
? Which stylesheet format would you like to use? (Use arrow keys)
> CSS             [ https://developer.mozilla.org/docs/Web/CSS                     ]
  Sass (SCSS)     [ https://sass-lang.com/documentation/syntax#scss                ]
  Sass (Indented) [ https://sass-lang.com/documentation/syntax#the-indented-syntax ]
Less [ http://lesscss.org ]- By default, a CSS-based application is created. Use SCSS if required:
ng new syncfusion-angular-app --style=scss- During project setup, when prompted for the Server-side rendering (SSR) option, choose the appropriate configuration.

- Select the required AI tool or ‘none’ if you do not need any AI tool.
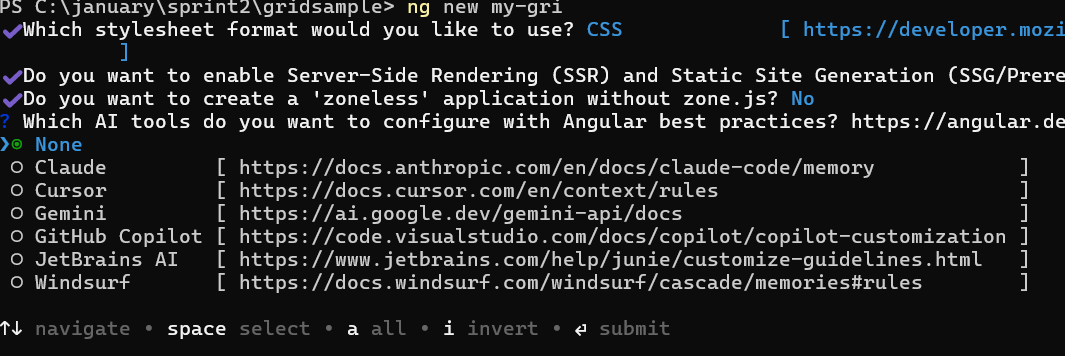
- Navigate to your newly created application directory:
cd syncfusion-angular-appIn Angular 19 and below, the CLI generates files like
app.component.ts,app.component.html,app.component.css, etc. In Angular 20+, the CLI generates a simpler structure withsrc/app/app.ts,app.html, andapp.css(no.component.suffixes).
Adding the Syncfusion® Angular Bullet Chart package
To install the Syncfusion® Angular Bullet Chart package, use the following command:
ng add @syncfusion/ej2-angular-chartsThe ng add command installs the package, registers it in package.json, and configures the required entries in your workspace automatically.
If ng add is unavailable in your setup, install the package manually with:
npm install @syncfusion/ej2-angular-chartsAdd Syncfusion® Bullet Chart component
Replace the contents of src/app/app.ts (Angular 20+) or src/app/app.component.ts (Angular 19 and below) with the following:
import { Component } from '@angular/core';
import { BulletChartModule } from '@syncfusion/ej2-angular-charts';

@Component({
    imports: [BulletChartModule],
    standalone: true,
    selector: 'app-root',
    // specifies the template string for the Bullet Chart component
    template: `<ejs-bulletchart id="chart-container"></ejs-bulletchart>`
})
export class AppComponent {

}
import { bootstrapApplication } from '@angular/platform-browser';
import { AppComponent } from './app.component';
bootstrapApplication(AppComponent).catch((err) => console.error(err));Run the application
Run the application using the following command:
ng serveModule Injection
Bullet Chart components are segregated into individual feature-wise modules. To use a particular feature, you need to inject its feature service in src/app/app.ts (Angular 20+) or src/app/app.component.ts (Angular 19 and below). This example will use the tooltip feature of the chart.
-
BulletTooltipService- Inject this provider to use the tooltip feature.
Replace the contents of src/app/app.ts (or src/app/app.component.ts on Angular 19 and below) with the following:
import { Component } from '@angular/core';
import { BulletChartModule, BulletTooltipService } from '@syncfusion/ej2-angular-charts';

@Component({
    imports: [BulletChartModule],
    standalone: true,
    selector: 'app-root',
    providers: [BulletTooltipService],
    template: `<ejs-bulletchart id='container' [tooltip]='tooltip'></ejs-bulletchart>`,
})
export class AppComponent {
    public tooltip: Object = { enable: true };
}
Bind data to the Bullet Chart
This section explains how to plot JSON data to the Bullet Chart. Replace the contents of src/app/app.ts (Angular 20+) or src/app/app.component.ts (Angular 19 and below) with the following:
import { Component } from '@angular/core';
import { BulletChartModule, BulletTooltipService } from '@syncfusion/ej2-angular-charts';

@Component({
    imports: [BulletChartModule],
    standalone: true,
    selector: 'app-root',
    providers: [BulletTooltipService],
    template: `<ejs-bulletchart valueField='value' targetField='target'
                [minimum]='minimum' [tooltip]='tooltip' [maximum]='maximum' [interval]='interval' [dataSource]='data'>
                </ejs-bulletchart>`
})
export class AppComponent {
    public minimum: number = 0;
    public maximum: number = 300;
    public interval: number = 50;
    public data: Object[] = [
        { value: 100, target: 80 },
        { value: 200, target: 180 },
        { value: 300, target: 280 },
        { value: 400, target: 380 },
        { value: 500, target: 480 },
    ];
    public tooltip: Object = { enable: true };
}
import { bootstrapApplication } from '@angular/platform-browser';
import { AppComponent } from './app.component';
bootstrapApplication(AppComponent).catch((err) => console.error(err));The data is bound via the dataSource property. The value and target keys in each data row are mapped through the valueField and targetField properties, and the chart’s value axis is configured with explicit minimum, maximum, and interval values.
The Bullet Chart renders one horizontal bar per data row, with a small target marker indicating the goal value. Bars are drawn against a quantitative axis.
Troubleshooting
If the Bullet Chart does not render as expected, check for these common issues:
-
“No provider for BulletTooltipService” error: Confirm that the relevant
*Serviceis added to the component’sprovidersarray. Each feature requires its corresponding service. -
Chart not visible: Verify that
ViewEncapsulation.Noneis set on the component, that theidon<ejs-bulletchart>is unique, and that theselectormatches the root element inindex.html. -
Data not displayed: Check that the
valueFieldandtargetFieldvalues match the field names in your data source exactly. -
Build errors: Run
ng versionto confirm that Node.js, Angular CLI, and@syncfusion/ej2-angular-chartsare on supported versions.