Getting Started with Angular Accumulation Chart Component
20 May 20266 minutes to read
This section explains the steps required to create a simple accumulation chart and demonstrates the basic usage of the accumulation chart component.
Ready to streamline your Syncfusion® Angular development? Discover the full potential of Syncfusion® Angular components with Syncfusion® AI Coding Assistant. Effortlessly integrate, configure, and enhance your projects with intelligent, context-aware code suggestions, streamlined setups, and real-time insights—all seamlessly integrated into your preferred AI-powered IDEs like VS Code, Cursor, Syncfusion® CodeStudio and more. Explore Syncfusion® AI Coding Assistant
Prerequisites
Before getting started, ensure that your development environment meets the system requirements for Syncfusion® Angular UI components.
Before You Begin
This guide uses the standalone application structure generated by the latest Angular CLI.
The main files used in this guide are:
-
src/app/app.ts— Defines the root standalone component. -
src/index.html— Contains the Angular root element.
NOTE
In newer Angular CLI standalone projects, the root component may be generated as
src/app/app.ts. In NgModule-based Angular projects, the equivalent file is typicallysrc/app/app.component.ts.
NOTE
If your application uses an older NgModule-based structure, import
AccumulationChartModulein the application module, such asapp.module.ts, instead of adding it to the standalone componentimportscollection.
Step 1: Create a Project Folder
Create a folder named my-project in your desired location. This folder will contain your Syncfusion Accumulation Chart Angular project.
Step 2: Set up the Angular environment
Start by opening your project in the terminal on your system (Command Prompt, PowerShell, or Terminal).
Use Angular CLI to create and manage Angular applications. Install Angular CLI globally using the following command:
npm install -g @angular/cliStep 3: Create an Angular application
Create a new Angular application using the following command.
ng new my-accumulation-chart-appDuring project creation, Angular CLI may prompt you to choose stylesheet, SSR/SSG, and AI tool configuration options. For this basic Accumulation Chart sample, you can use the following options:
-
Stylesheet system: Choose any option. This guide uses
CSSfor simplicity and applies the Syncfusion® Tailwind 3 theme through CSS imports. -
SSR and SSG/Pre-rendering: Select
No. -
AI tools configuration: Select
None.
Navigate to the project folder:
cd my-accumulation-chart-appStep 4: Install the Syncfusion® Angular Accumulation Chart package
All Syncfusion Essential® JS 2 packages are available in the npmjs.com registry.
Install the Angular Accumulation Chart package using the following command:
npm install @syncfusion/ej2-angular-charts --saveNOTE
Installing
@syncfusion/ej2-angular-chartsautomatically installs the required dependency packages.
Step 5: Register the Accumulation Chart module and add the component
Import AccumulationChartModule from @syncfusion/ej2-angular-charts and add it to the imports collection of the standalone component. Then, add the Angular Accumulation Chart component using the <ejs-accumulationchart> selector in the component template.
Update the src/app/app.ts file as follows:
import { Component } from '@angular/core';
import { AccumulationChartModule } from '@syncfusion/ej2-angular-charts';

@Component({
  selector: 'app-root',
  standalone: true,
  imports: [AccumulationChartModule],
  providers: [],
  template: `<ejs-accumulationchart id="pie-container"></ejs-accumulationchart>`
})
export class App {}
This renders an empty accumulation chart in the application.
NOTE
The component selector must match the root element used in the
src/index.htmlfile. Angular CLI commonly uses<app-root></app-root>, so this example usesselector: 'app-root'.
Step 6: Create your first Accumulation Chart with data source and series type
This section explains how to create a simple accumulation chart by binding data and rendering a series using Angular Accumulation Chart components.
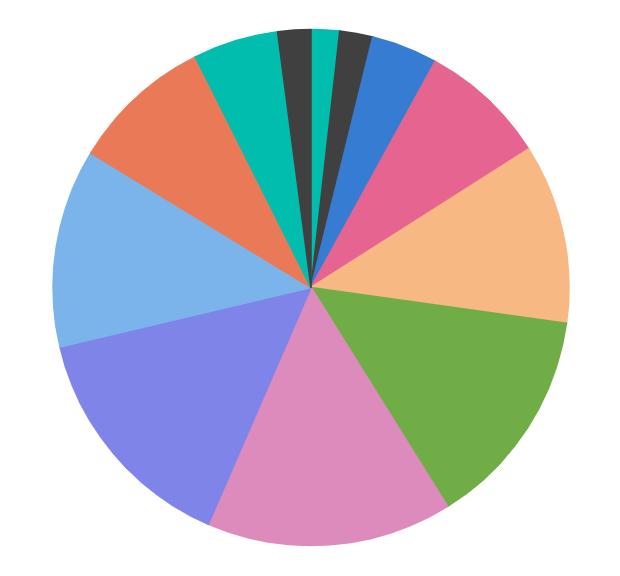
The following example demonstrates how to visualize monthly data using a pie chart. It also shows how to bind data and map fields using the dataSource, xName, and yName properties, along with configuring the legend using the legendSettings property.
Update the src/app/app.ts file as follows:
import { Component, OnInit } from '@angular/core';
import { AccumulationChartModule, PieSeriesService, AccumulationLegendService } from '@syncfusion/ej2-angular-charts';

@Component({
    selector: 'app-root',
    standalone: true,
    imports: [AccumulationChartModule],
    providers: [PieSeriesService, AccumulationLegendService],
    template: `
        <ejs-accumulationchart
            id="pie-container"
            [legendSettings]='legendSettings'
        >
            <e-accumulation-series-collection>
                <e-accumulation-series
                    [dataSource]='piedata'
                    xName='x'
                    yName='y'
                >
                </e-accumulation-series>
            </e-accumulation-series-collection>
        </ejs-accumulationchart>
    `
})
export class App implements OnInit {
    public piedata?: Object[];
    public legendSettings?: Object;
    ngOnInit(): void {
        this.piedata = [
            { x: 'Jan', y: 3 }, { x: 'Feb', y: 3.5 },
            { x: 'Mar', y: 7 }, { x: 'Apr', y: 13.5 },
            { x: 'May', y: 19 }, { x: 'Jun', y: 23.5 },
            { x: 'Jul', y: 26 }, { x: 'Aug', y: 25 },
            { x: 'Sep', y: 21 }, { x: 'Oct', y: 15 },
            { x: 'Nov', y: 9 }, { x: 'Dec', y: 3.5 }
        ];
        this.legendSettings = {
            visible: false
        };
    }
}
In this example:
-
legendSettingscontrols the visibility and appearance of the accumulation chart legend. -
dataSourceprovides the JSON data used to render the accumulation chart. -
typespecifies the accumulation series type, such as Pie, Pyramid, or Funnel. -
xNamemaps the category field (for example, x) from the data source. -
yNamemaps the numeric field (for example, y) from the data source. - [
<e-accumulation-series-collection>] and [<e-accumulation-series>] directives are used to define and render an accumulation series in the chart.
Step 7: Run the application
Run the application using the following command:
npm startOpen the generated local URL (for example, http://localhost:4200/) from terminal in the browser. The application displays the accumulation chart as shown below: