- Prerequisites
- Creating Vue application using Vue CLI
- Adding Syncfusion Stock Chart package in the application
- Adding Syncfusion Stock Chart component in the application
Contact Support
Getting Started with Syncfusion Stock Chart component in Vue 3
23 Mar 20236 minutes to read
This section explains how to use Stock Chart component in Vue 3 application.
Prerequisites
System requirements for Syncfusion Vue UI components
Creating Vue application using Vue CLI
The easiest way to create a Vue application is to use the Vue CLI. Vue CLI versions above 4.5.0 are mandatory for creating applications using Vue 3. Use the following command to uninstall older versions of the Vue CLI.
npm uninstall vue-cli -gUse the following commands to install the latest version of Vue CLI.
npm install -g @vue/cli
npm install -g @vue/cli-init
Create a new project using the command below.
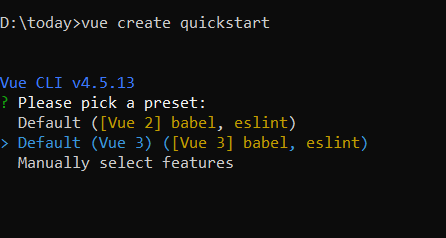
vue create quickstartInitiating a new project prompts us to choose the type of project to be used for the current application. Select the option Default (Vue 3) from the menu.
Adding Syncfusion Stock Chart package in the application
Syncfusion Vue packages are maintained in the npmjs.com registry. The Stock Chart component will be used in this example. To install it in the quickstart folder use the following command.
npm install @syncfusion/ej2-vue-charts --saveAdding Syncfusion Stock Chart component in the application
You have completed all the necessary configurations needed for rendering the Syncfusion Vue component. Now, you are going to add the Stock Chart component using following steps.
1. Import the Stock Chart component in the <script> section of the src/App.vue file.
```
<script>
import { StockChartComponent, CandleSeries, DateTime, StockChartSeriesCollectionDirective, StockChartSeriesDirective, StockChart } from "@syncfusion/ej2-vue-charts";
</script>
```
2. Register the Stock Chart component along with the required child directives which are used in this example. Find the list of child directives and the tag names that can be used in the Stock Chart component in the following table.
| Directive Name              | Tag Name              |
|-----------------------------|-----------------------|
| `SeriesCollectionDirective` | `e-series-collection` |
| `SeriesDirective`           | `e-series`            |

```js
import { StockChartComponent, CandleSeries, DateTime, StockChartSeriesCollectionDirective, StockChartSeriesDirective, StockChart } from "@syncfusion/ej2-vue-charts";
//Component registeration.
export default {
  name: "App",
  components: {
    "ejs-stockchart": StockChartComponent,
    "e-stockchart-series-collection": StockChartSeriesCollectionDirective,
    "e-stockchart-series": StockChartSeriesDirective
  },
};

```
In the above code snippet, you have registered Stock Chart and the directives for series. Series directives are used to visualize the data with different Stock Chart types like Line, Hilo, Candle etc.
3. Add the component definition in template section.
```
<template>
  <ejs-stockchart
    :primaryXAxis="primaryXAxis"
    :primaryYAxis="primaryYAxis"
    :title="title"
  >
    <e-stockchart-series-collection>
      <e-stockchart-series
        :dataSource="seriesData"
        type="Candle"
        volume="volume"
        xName="date"
        low="low"
        high="high"
        open="open"
        close="close"
        yName="open"
      ></e-stockchart-series>
    </e-stockchart-series-collection>
  </ejs-stockchart>
</template>

```
Above is the Stock Chart component with dataSource bound to series directives.
4. Define the collection seriesData which is bound for the dataSource, primaryXAxis, primaryYAxis and title properties in the script section.
```js
  data() {
    return {
      seriesData: [
        {
            date: new Date('2012-04-02'),
            open: 85.9757,
            high: 90.6657,
            low: 85.7685,
            close: 90.5257,
            volume: 660187068
        },
        {
            date: new Date('2012-04-09'),
            open: 89.4471,
            high: 92,
            low: 86.2157,
            close: 86.4614,
            volume: 912634864
        },
        ....
      ],
      primaryXAxis: {
        valueType: "DateTime"
      },
      primaryYAxis: {
        majorTickLines: { color: "transparent", width: 0 },
      },
      title: "AAPL Stock Price",
    };
  },

```
5. Summarizing the above steps, update the src/App.vue file with following code.
```
<template>
  <ejs-stockchart
    :primaryXAxis="primaryXAxis"
    :primaryYAxis="primaryYAxis"
    :title="title"
  >
    <e-stockchart-series-collection>
      <e-stockchart-series
        :dataSource="seriesData"
        type="Candle"
        volume="volume"
        xName="date"
        low="low"
        high="high"
        open="open"
        close="close"
        yName="open"
      ></e-stockchart-series>
    </e-stockchart-series-collection>
  </ejs-stockchart>
</template>

<script>
import {
  StockChartComponent,
  CandleSeries,
  DateTime,
  StockChartSeriesCollectionDirective,
  StockChartSeriesDirective
} from "@syncfusion/ej2-vue-charts";

export default {
  name: "App",
  components: {
    "ejs-stockchart": StockChartComponent,
    "e-stockchart-series-collection": StockChartSeriesCollectionDirective,
    "e-stockchart-series": StockChartSeriesDirective
  },
  data() {
    return {
      seriesData: [
        {
            date: new Date('2012-04-02'),
            open: 85.9757,
            high: 90.6657,
            low: 85.7685,
            close: 90.5257,
            volume: 660187068
        },
        {
            date: new Date('2012-04-09'),
            open: 89.4471,
            high: 92,
            low: 86.2157,
            close: 86.4614,
            volume: 912634864
        },
        ....
      ],
      primaryXAxis: {
        valueType: "DateTime"
      },
      primaryYAxis: {
        majorTickLines: { color: "transparent", width: 0 },
      },
      title: "AAPL Stock Price",
    };
  },
};
</script>

```
6. Run the application using the following command.
```bash
npm run serve
```
The web server will be initiated and open the quickstart app in the browser at port localhost:8080.
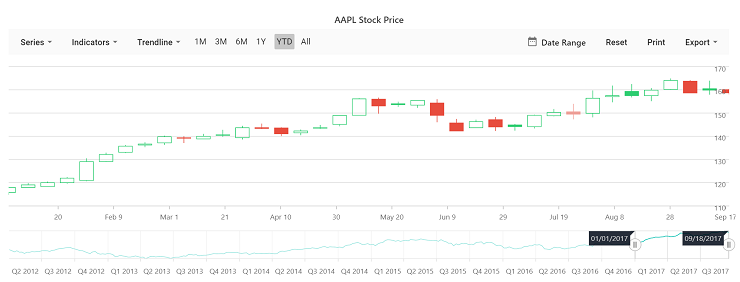
Refer the following sample, vue3-stockchart-getting-started.