Getting Started with Syncfusion Pivot Table component in Vue 3
20 Mar 202320 minutes to read
This section explains how to use the Pivot Table component in Vue 3 application.
Prerequisites
System requirements for Syncfusion Vue UI components
Creating Vue application using Vue CLI
The easiest way to create a Vue application is to use the Vue CLI. Vue CLI versions above 4.5.0 are mandatory for creating applications using Vue 3. Use the following command to uninstall older versions of the Vue CLI.
npm uninstall vue-cli -gUse the following commands to install the latest version of Vue CLI.
npm install -g @vue/cli
npm install -g @vue/cli-init
Create a new project using the command below.
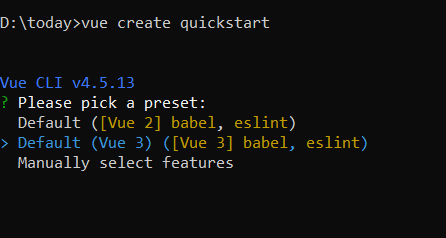
vue create quickstart
cd quickstart
Initiating a new project prompts us to choose the type of project to be used for the current application. Select the option Default (Vue 3) from the menu.
Adding Syncfusion Pivot Table package in the application
Syncfusion Vue packages are maintained in the npmjs.com registry. The Pivot Table component will be used in this example. To install it in the quickstart folder use the following command.
npm install @syncfusion/ej2-vue-pivotview --saveAdding CSS reference for Syncfusion Pivot Table component
Import the needed CSS styles for the Pivot Table component along with dependency styles in the <style> section of the src/App.vue file as follows.
<style>
  @import "../node_modules/@syncfusion/ej2-base/styles/material.css";
  @import "../node_modules/@syncfusion/ej2-inputs/styles/material.css";
  @import "../node_modules/@syncfusion/ej2-buttons/styles/material.css";
  @import "../node_modules/@syncfusion/ej2-dropdowns/styles/material.css";
  @import "../node_modules/@syncfusion/ej2-lists/styles/material.css";
  @import "../node_modules/@syncfusion/ej2-popups/styles/material.css";
  @import "../node_modules/@syncfusion/ej2-navigations/styles/material.css";
  @import "../node_modules/@syncfusion/ej2-grids/styles/material.css";
  @import "../node_modules/@syncfusion/ej2-vue-pivotview/styles/material.css";
</style>
Other Syncfusion components are dependent to the Pivot Table component. To use all of the pivot functions, the dependent component’s CSS references must also be added.
Adding Syncfusion Pivot Table component in the application
You have completed all the necessary configurations needed for rendering the Syncfusion Vue component. Now, you are going to add the Pivot Table component using following steps.
1. Import the Pivot Table component in the <script> section of the src/App.vue file.
<script>
  import { PivotViewComponent, FieldList, GroupingBar, CalculatedField } from "@syncfusion/ej2-vue-pivotview";
</script>
2. Register the Pivot Table component which is used in this example.
import { PivotViewComponent, FieldList, GroupingBar, CalculatedField } from "@syncfusion/ej2-vue-pivotview";
//Component registeration.
export default {
    name: "App",
    components: {
      "ejs-pivotview": PivotViewComponent
    }
}
3. Add the component definition in template section.
<template>
  <ejs-pivotview :height="height" :width="width" :dataSourceSettings="dataSourceSettings" :showFieldList="showFieldList" :showGroupingBar="showGroupingBar" :allowCalculatedField="allowCalculatedField"></ejs-pivotview>
</template>
Above is the Pivot Table component definition with height, width, dataSourceSettings, showFieldList, showGroupingBar and allowCalculatedField properties.
4. Declare the bound properties in the script section. Declare the collection of data assigned to the dataSource under dataSourceSettings which is bound for the Pivot Table’s dataSourceSettings property. Likewise, there are others.
export default {
  ...
  ...
  data() {
    return {
      dataSourceSettings: {
        dataSource: [
          { Amount: 5100, Country: "Canada", Date: "FY 2006", Product: "Car", Quantity: 21, State: "Alberta" },
          { Amount: 1900, Country: "France", Date: "FY 2007", Product: "Car", Quantity: 23, State: "Alberta" },
          { Amount: 1000, Country: "Germany", Date: "FY 2008", Product: "Car", Quantity: 29, State: "Alberta" },
          { Amount: 2060, Country: "Canada", Date: "FY 2006", Product: "Car", Quantity: 93, State: "British Columbia" },
          { Amount: 6200, Country: "France", Date: "FY 2007", Product: "Car", Quantity: 36, State: "British Columbia" },
          { Amount: 2000, Country: "Germany", Date: "FY 2008", Product: "Car", Quantity: 31, State: "British Columbia" },
          { Amount: 1300, Country: "Canada", Date: "FY 2005", Product: "Car", Quantity: 45, State: "Brunswick" },
          { Amount: 3400, Country: "France", Date: "FY 2006", Product: "Car", Quantity: 47, State: "Brunswick" },
          { Amount: 2300, Country: "Germany", Date: "FY 2007", Product: "Car", Quantity: 43, State: "Brunswick" },
        ],
        rows: [{ name: 'Country' }],
        columns: [{ name: 'Date' }],
        values: [{ name: 'Amount' }, { name: 'Total', type: 'CalculatedField' }],
        formatSettings: [{ name: 'Amount', format: 'C1' }],
        calculatedFieldSettings: [{ name: 'Total', formula: '"Sum(Amount)"+"Sum(Quantity)"' }]
      },
      showFieldList: true,
      showGroupingBar: true,
      allowCalculatedField: true,
      height: '350px',
      width: '100%'
    };
  }
  ...
  ...
};
5. Summarizing the above steps, update the src/App.vue file with following code.
<template>
  <ejs-pivotview :height="height" :width="width" :dataSourceSettings="dataSourceSettings" :showFieldList="showFieldList" :showGroupingBar="showGroupingBar" :allowCalculatedField="allowCalculatedField">
  </ejs-pivotview>
</template>

<script>
  import { PivotViewComponent, FieldList, GroupingBar, CalculatedField } from "@syncfusion/ej2-vue-pivotview";

  export default {
    name: "App",
    // Declaring component and its directives.
    components: {
      "ejs-pivotview": PivotViewComponent
    },
    // Bound properties declaration.
    data() {
      return {
        dataSourceSettings: {
          dataSource: [
            { Amount: 5100, Country: "Canada", Date: "FY 2006", Product: "Car", Quantity: 21, State: "Alberta" },
            { Amount: 1900, Country: "France", Date: "FY 2007", Product: "Car", Quantity: 23, State: "Alberta" },
            { Amount: 1000, Country: "Germany", Date: "FY 2008", Product: "Car", Quantity: 29, State: "Alberta" },
            { Amount: 2060, Country: "Canada", Date: "FY 2006", Product: "Car", Quantity: 93, State: "British Columbia" },
            { Amount: 6200, Country: "France", Date: "FY 2007", Product: "Car", Quantity: 36, State: "British Columbia" },
            { Amount: 2000, Country: "Germany", Date: "FY 2008", Product: "Car", Quantity: 31, State: "British Columbia" },
            { Amount: 1300, Country: "Canada", Date: "FY 2005", Product: "Car", Quantity: 45, State: "Brunswick" },
            { Amount: 3400, Country: "France", Date: "FY 2006", Product: "Car", Quantity: 47, State: "Brunswick" },
            { Amount: 2300, Country: "Germany", Date: "FY 2007", Product: "Car", Quantity: 43, State: "Brunswick" },
          ],
          rows: [{ name: 'Country' }],
          columns: [{ name: 'Date' }],
          values: [{ name: 'Amount' }, { name: 'Total', type: 'CalculatedField' }],
          formatSettings: [{ name: 'Amount', format: 'C1' }],
          calculatedFieldSettings: [{ name: 'Total', formula: '"Sum(Amount)"+"Sum(Quantity)"' }]
        },
        showFieldList: true,
        showGroupingBar: true,
        allowCalculatedField: true,
        height: '350px',
        width: '100%'
      };
    },
    // Injecting the required modules for additional features.
    pivotview: [GroupingBar, FieldList, CalculatedField]
  };
</script>
<style>
  @import "../node_modules/@syncfusion/ej2-base/styles/material.css";
  @import "../node_modules/@syncfusion/ej2-inputs/styles/material.css";
  @import "../node_modules/@syncfusion/ej2-buttons/styles/material.css";
  @import "../node_modules/@syncfusion/ej2-dropdowns/styles/material.css";
  @import "../node_modules/@syncfusion/ej2-lists/styles/material.css";
  @import "../node_modules/@syncfusion/ej2-popups/styles/material.css";
  @import "../node_modules/@syncfusion/ej2-navigations/styles/material.css";
  @import "../node_modules/@syncfusion/ej2-grids/styles/material.css";
  @import "../node_modules/@syncfusion/ej2-vue-pivotview/styles/material.css";
</style>
6. Run the application using the following command.
npm run serveThe web server will be initiated and open the quickstart app in the browser at port localhost:8080.
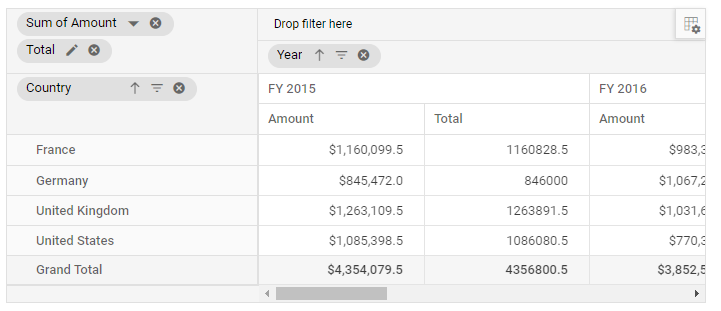
Refer the following sample, vue3-pivottable-getting-started.
Using template properties in the component
The following sample uses the HTML elements to showcase each cell with custom format using the Pivot Table’s cellTemplate property.
<template>
  <ejs-pivotview id="pivotview" ref="pivotview" :dataSourceSettings="dataSourceSettings" :height="height" :dataBound="trend" :cellTemplate="cellTemplate"></ejs-pivotview>
</template>

<script>
  import { PivotViewComponent } from "@syncfusion/ej2-vue-pivotview";
  import { createApp } from 'vue/dist/vue.esm-bundler';

  const app = createApp();

  // Template declaration.
  var colVue = app.component("cellTemplate", {
    data() {
      return {
        data: {},
      };
    },
    methods: {
      getCellContent: function () {
        return '<span class="tempwrap sb-icon-neutral pv-icons"></span>';
      },
    },
    template: `<span class="template-wrap"><span class="tempwrap sb-icon-neutral pv-icons"></span></span>`,
  });

  export default {
    name: "App",
    components: {
      "ejs-pivotview": PivotViewComponent,
    },
    data() {
      return {
        dataSourceSettings: {
          dataSource: [
            { Amount: 5100, Country: "Canada", Date: "FY 2006", Product: "Car", Quantity: 21, State: "Alberta" },
            { Amount: 1900, Country: "France", Date: "FY 2007", Product: "Car", Quantity: 23, State: "Alberta" },
            { Amount: 1000, Country: "Germany", Date: "FY 2008", Product: "Car", Quantity: 29, State: "Alberta" },
            { Amount: 2060, Country: "Canada", Date: "FY 2006", Product: "Car", Quantity: 93, State: "British Columbia" },
            { Amount: 6200, Country: "France", Date: "FY 2007", Product: "Car", Quantity: 36, State: "British Columbia" },
            { Amount: 2000, Country: "Germany", Date: "FY 2008", Product: "Car", Quantity: 31, State: "British Columbia" },
            { Amount: 1300, Country: "Canada", Date: "FY 2005", Product: "Car", Quantity: 45, State: "Brunswick" },
            { Amount: 3400, Country: "France", Date: "FY 2006", Product: "Car", Quantity: 47, State: "Brunswick" },
            { Amount: 2300, Country: "Germany", Date: "FY 2007", Product: "Car", Quantity: 43, State: "Brunswick" },
          ],
          rows: [{ name: "Country" }],
          columns: [{ name: "Date" }],
          values: [{ name: "Amount" }, { name: "Total", type: 'CalculatedField' }],
          formatSettings: [{ name: "Amount", format: "C1" }],
          calculatedFieldSettings: [{ name: 'Total', formula: '"Sum(Amount)"+"Sum(Quantity)"' }]
        },
        height: 350,
        cellTemplate: function () {
          return { template: colVue };
        },
      };
    },
    methods: {
      trend: function () {
        let pivotGridObj = this.$refs.pivotview.ej2Instances;
        var cTable = document.getElementsByClassName("e-table");
        var colLen = pivotGridObj.pivotValues[3].length;
        var cLen = cTable[3].children[0].children.length;
        var rLen = cTable[3].children[1].children.length;
        for (let k = 0; k < rLen; k++) {
          if (
            pivotGridObj.pivotValues[k] &&
            pivotGridObj.pivotValues[k][0] !== undefined
          ) {
            break;
          }
        }
        var rowHeaders = [].slice.call(
          cTable[2].children[1].querySelectorAll("td")
        );
        var rows = pivotGridObj.dataSourceSettings.rows;
        if (rowHeaders.length > 1) {
          for (var i = 0, Cnt = rows; i < Cnt.length; i++) {
            var fields = {};
            var fieldHeaders = [];
            for (var j = 0, Lnt = rowHeaders; j < Lnt.length; j++) {
              var header = rowHeaders[j];
              if (
                header.className.indexOf("e-gtot") === -1 &&
                header.className.indexOf("e-rowsheader") > -1 &&
                header.getAttribute("fieldname") === rows[i].name
              ) {
                fields[rowHeaders[j].textContent] = j;
                fieldHeaders.push(rowHeaders[j].textContent);
              }
            }
            if (i === 0) {
              for (var rnt = 0, Lnt1 = fieldHeaders; rnt < Lnt1.length; rnt++) {
                if (rnt !== 0) {
                  var row = fields[fieldHeaders[rnt]];
                  var prevRow = fields[fieldHeaders[rnt - 1]];
                  for (var k = 0, ci = 1; k < cLen && ci < colLen; k++, ci++) {
                    var node = cTable[3].children[1].children[row].childNodes[k];
                    var prevNode =
                      cTable[3].children[1].children[prevRow].childNodes[k];
                    var ri = node.getAttribute("index");
                    var prevRi = prevNode.getAttribute("index");
                    if (ri < pivotGridObj.pivotValues.length) {
                      if (
                        pivotGridObj.pivotValues[prevRi][ci].value >
                          pivotGridObj.pivotValues[ri][ci].value &&
                        node.querySelector(".tempwrap")
                      ) {
                        var trendElement = node.querySelector(".tempwrap");
                        trendElement.className = trendElement.className.replace(
                          "sb-icon-neutral",
                          "sb-icon-loss"
                        );
                      } else if (
                        pivotGridObj.pivotValues[prevRi][ci].value <
                          pivotGridObj.pivotValues[ri][ci].value &&
                        node.querySelector(".tempwrap")
                      ) {
                        var trendElement1 = node.querySelector(".tempwrap");
                        trendElement1.className = trendElement1.className.replace(
                          "sb-icon-neutral",
                          "sb-icon-profit"
                        );
                      }
                    }
                  }
                }
              }
            }
          }
        }
      },
    },
  };
</script>

<style scoped>

  @import "../node_modules/@syncfusion/ej2-base/styles/material.css";
  @import "../node_modules/@syncfusion/ej2-inputs/styles/material.css";
  @import "../node_modules/@syncfusion/ej2-buttons/styles/material.css";
  @import "../node_modules/@syncfusion/ej2-dropdowns/styles/material.css";
  @import "../node_modules/@syncfusion/ej2-lists/styles/material.css";
  @import "../node_modules/@syncfusion/ej2-popups/styles/material.css";
  @import "../node_modules/@syncfusion/ej2-navigations/styles/material.css";
  @import "../node_modules/@syncfusion/ej2-grids/styles/material.css";
  @import "../node_modules/@syncfusion/ej2-vue-pivotview/styles/material.css";

  /deep/ #pivotview {
    width: 100%;
  }

  @font-face {
    font-family: "e-pivot";
    src: /* To get the output shown below, add the resource containing font data from the below reference sample. */
    font-weight: normal;
    font-style: normal;
  }

  /deep/ .pv-icons {
    font-family: "e-pivot";
    font-style: normal;
    font-variant: normal;
    font-weight: normal;
    text-transform: none;
    line-height: 1;
  }

  /deep/ .sb-icon-profit::before {
    content: "\e234";
    padding-left: 30px;
    margin: auto !important;
    color: #219122;
    size: 20px;
  }

  /deep/ .sb-icon-neutral::before {
    content: "\e84d";
    padding-left: 30px;
    margin: auto !important;
    color: #82b5e9;
  }

  /deep/ .sb-icon-loss::before {
    content: "\e239";
    padding-left: 30px;
    margin: auto !important;
    color: #ff2222;
  }

  /deep/ .sb-sample-content-area {
    min-height: 255px !important;
  }

  /deep/ .control-section {
    min-height: 255px !important;
  }

  /deep/ .e-columnsheader .tempwrap.sb-icon-neutral.pv-icons{
    display: none !important;
  }

  /deep/ .e-rowsheader .tempwrap.sb-icon-neutral.pv-icons {
    display: none !important;
  }

  /deep/ .e-pivotview .e-grid .e-rowcell {
      font-size: 13px;
      padding-left: 8px;
  }

  /deep/ .e-cellvalue {
    margin-top: 8px;
    display: flex;
    margin-left: 30px;
  }
</style>
Output be like the below.
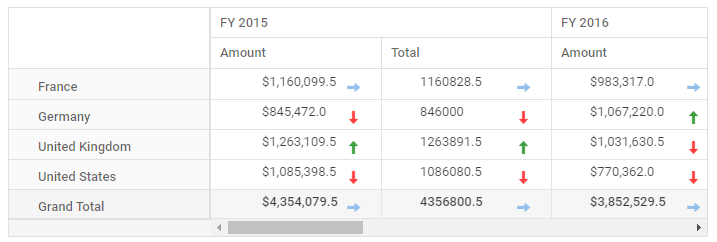
Refer the following sample, vue3-pivottable-celltemplate.