Swim lane in Vue Diagram component

11 Jun 202424 minutes to read

Swimlane is a type of diagram nodes,which is typically used to visualize the relationship between a business process and the department responsible for it by focusing on the logical relationships between activities.

Create a swimlane

To create a swimlane,the type of shape should be set as swimlane.By Default swimlane’s are arranged vertically.

The following code example illustrates how to define a swimlane object.

<template>
    <div id="app">
        <ejs-diagram id="diagram" :width='width' :height='height' :nodes='nodes'></ejs-diagram>
    </div>
</template>
<script setup>
import { DiagramComponent as EjsDiagram } from '@syncfusion/ej2-vue-diagrams';

let nodes = [{
    shape: {
        // Set the node type as swimlane
        type: 'SwimLane',
        lanes: [
            {
                id: 'stackCanvas1',
                height: 100,
            },
        ],
        phases: [
            {
                id: 'phase1', offset: 170,
                header: { annotation: { content: 'Phase' } }
            },
        ],
        phaseSize: 20,
    },
    offsetX: 300, offsetY: 200,
    height: 200,
    width: 350
}];

const width = "100%";
const height = "350px";
</script>
<style>
@import "../node_modules/@syncfusion/ej2-vue-diagrams/styles/material.css";
</style>
<template>
    <div id="app">
        <ejs-diagram id="diagram" :width='width' :height='height' :nodes='nodes'></ejs-diagram>
    </div>
</template>
<script>
import { DiagramComponent } from '@syncfusion/ej2-vue-diagrams';

let nodes = [{
    shape: {
        // Set the node type as swimlane
        type: 'SwimLane',
        lanes: [
            {
                id: 'stackCanvas1',
                height: 100,
            },
        ],
        phases: [
            {
                id: 'phase1', offset: 170,
                header: { annotation: { content: 'Phase' } }
            },
        ],
        phaseSize: 20,
    },
    offsetX: 300, offsetY: 200,
    height: 200,
    width: 350
}];

export default {
    name: "App",
    components: {
        "ejs-diagram": DiagramComponent
    },
    data() {
        return {
            width: "100%",
            height: "350px",
            nodes: nodes,
        }
    }
}
</script>
<style>
@import "../node_modules/@syncfusion/ej2-vue-diagrams/styles/material.css";
</style>

Headers

Header was the primary element for swimlanes. The header property of swimlane allows you to define its textual description and to customize its appearance.

Note: By using this header,the swimlane interaction will be performed,like selection, dragging,etc.

The following code example illustrates how to define a swimlane header.

<template>
    <div id="app">
        <ejs-diagram id="diagram" :width='width' :height='height' :nodes='nodes'></ejs-diagram>
    </div>
</template>
<script setup>
import { DiagramComponent as EjsDiagram } from '@syncfusion/ej2-vue-diagrams';

const nodes = [{
    shape: {
        type: 'SwimLane',
        orientation: 'Horizontal',
        // Intialize header to swimlane
        header: {
            annotation: { content: 'ONLINE PURCHASE STATUS', style: { fill: '#111111' } },
            height: 50, style: { fontSize: 11 },
        },
        lanes: [
            {
                id: 'stackCanvas1',
                height: 100,
            },
        ],
        phases: [
            {
                id: 'phase1', offset: 170,
                header: { annotation: { content: 'Phase' } }
            },
        ],
        phaseSize: 20,
    },
    offsetX: 300, offsetY: 200,
    height: 200,
    width: 350
}]

const width = "100%";
const height = "350px";

</script>
<style>
@import "../node_modules/@syncfusion/ej2-vue-diagrams/styles/material.css";
</style>
<template>
    <div id="app">
        <ejs-diagram id="diagram" :width='width' :height='height' :nodes='nodes'></ejs-diagram>
    </div>
</template>
<script>
import { DiagramComponent } from '@syncfusion/ej2-vue-diagrams';

const nodes = [{
    shape: {
        type: 'SwimLane',
        orientation: 'Horizontal',
        // Intialize header to swimlane
        header: {
            annotation: { content: 'ONLINE PURCHASE STATUS', style: { fill: '#111111' } },
            height: 50, style: { fontSize: 11 },
        },
        lanes: [
            {
                id: 'stackCanvas1',
                height: 100,
            },
        ],
        phases: [
            {
                id: 'phase1', offset: 170,
                header: { annotation: { content: 'Phase' } }
            },
        ],
        phaseSize: 20,
    },
    offsetX: 300, offsetY: 200,
    height: 200,
    width: 350
}];
export default {
    name: "App",
    components: {
        "ejs-diagram": DiagramComponent
    },
    data() {
        return {
            width: "100%",
            height: "350px",
            nodes: nodes,
        }
    }
}
</script>
<style>
@import "../node_modules/@syncfusion/ej2-vue-diagrams/styles/material.css";
</style>

Customization of headers

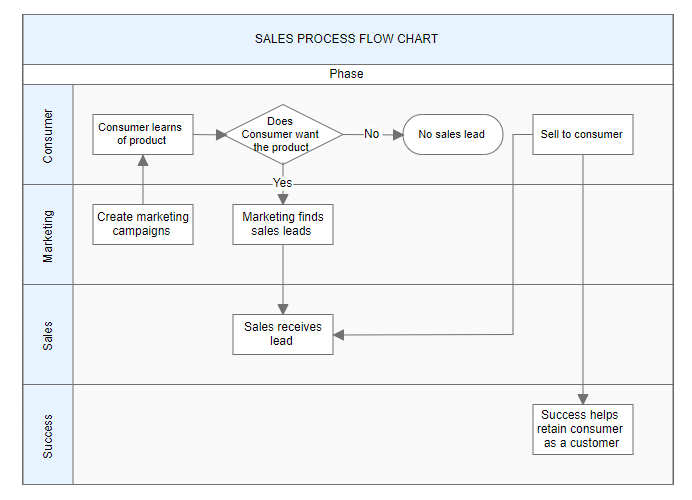
The height and width of swimlane header can be customized with weight and height properties of swimlane header. set fill color of header by using the style property. The orientation of swimlane can be customized with the orientation property of the header.

Note: By default the swimlane orientation has Horizontal.

The following code example illustrates how to customize the swimlane header..

<template>
    <div id="app">
        <ejs-diagram id="diagram" :width='width' :height='height' :nodes='nodes'></ejs-diagram>
    </div>
</template>
<script setup>
import { DiagramComponent as EjsDiagram } from '@syncfusion/ej2-vue-diagrams';

const nodes = [{
    shape: {
        type: 'SwimLane',
        orientation: 'Horizontal',
        // customize the swimlane header
        header: {
            annotation: { content: 'SALES PROCESS FLOW CHART', },
            height: 70, style: { fontSize: 11 }, style: { fill: 'pink' },
        },
        lanes: [
            {
                id: 'stackCanvas1',
                height: 100,
            },

        ],
        phases: [
            {
                id: 'phase1', offset: 170,
                header: { annotation: { content: 'Phase' } }
            },
        ],
        phaseSize: 20,
    },
    offsetX: 300, offsetY: 200,
    height: 200,
    width: 350
}];

const width = "100%";
const height = "350px";
</script>
<style>
@import "../node_modules/@syncfusion/ej2-vue-diagrams/styles/material.css";
</style>
<template>
    <div id="app">
        <ejs-diagram id="diagram" :width='width' :height='height' :nodes='nodes'></ejs-diagram>
    </div>
</template>
<script>
import { DiagramComponent } from '@syncfusion/ej2-vue-diagrams';

let nodes = [{
    shape: {
        type: 'SwimLane',
        orientation: 'Horizontal',
        // customize the swimlane header
        header: {
            annotation: { content: 'SALES PROCESS FLOW CHART', },
            height: 70, style: { fontSize: 11 }, style: { fill: 'pink' },
        },
        lanes: [
            {
                id: 'stackCanvas1',
                height: 100,
            },

        ],
        phases: [
            {
                id: 'phase1', offset: 170,
                header: { annotation: { content: 'Phase' } }
            },
        ],
        phaseSize: 20,
    },
    offsetX: 300, offsetY: 200,
    height: 200,
    width: 350
}];

export default {
    name: "App",
    components: {
        "ejs-diagram": DiagramComponent
    },
    data() {
        return {
            width: "100%",
            height: "350px",
            nodes: nodes,
        }
    }
}
</script>
<style>
@import "../node_modules/@syncfusion/ej2-vue-diagrams/styles/material.css";
</style>

Dynamic customization of swimlane header

You can customize the swimlane header style and text properties dynamically. The following code illustrates how to dynamically customize the lane header.

<template>
    <div id="app">
        <ejs-diagram id="diagram" ref="diagram" :width='width' :height='height' :nodes='nodes'></ejs-diagram>
    </div>
</template>
<script setup>
import { onMounted, ref } from "vue";
import { DiagramComponent as EjsDiagram } from '@syncfusion/ej2-vue-diagrams';

const diagram = ref(null);
const nodes = [{
    shape: {
        type: 'SwimLane',
        orientation: 'Horizontal',
        // customize the swimlane header
        header: {
            annotation: { content: 'SALES PROCESS FLOW CHART', },
            height: 70, style: { fontSize: 11 }, style: { fill: 'pink' },
        },
        lanes: [
            {
                id: 'stackCanvas1',
                height: 100,
            },

        ],
        phases: [
            {
                id: 'phase1', offset: 170,
                header: { annotation: { content: 'Phase' } }
            },
        ],
        phaseSize: 20,
    },
    offsetX: 300, offsetY: 200,
    height: 200,
    width: 350
}];

const width = "100%";
const height = "350px";

onMounted(function () {
    const diagramInstance = diagram.value.ej2Instances;
    diagramInstance.nodes[0].shape.header.style.fill = 'red'
    diagramInstance.dataBind();
});
</script>
<style>
@import "../node_modules/@syncfusion/ej2-vue-diagrams/styles/material.css";
</style>
<template>
    <div id="app">
        <ejs-diagram id="diagram" ref="diagram" :width='width' :height='height' :nodes='nodes'></ejs-diagram>
    </div>
</template>
<script>
import { DiagramComponent } from '@syncfusion/ej2-vue-diagrams';

let nodes = [{
    shape: {
        type: 'SwimLane',
        orientation: 'Horizontal',
        // customize the swimlane header
        header: {
            annotation: { content: 'SALES PROCESS FLOW CHART', },
            height: 70, style: { fontSize: 11 }, style: { fill: 'pink' },
        },
        lanes: [
            {
                id: 'stackCanvas1',
                height: 100,
            },

        ],
        phases: [
            {
                id: 'phase1', offset: 170,
                header: { annotation: { content: 'Phase' } }
            },
        ],
        phaseSize: 20,
    },
    offsetX: 300, offsetY: 200,
    height: 200,
    width: 350
}];

export default {
    name: "App",
    components: {
        "ejs-diagram": DiagramComponent
    },
    data() {
        return {
            width: "100%",
            height: "350px",
            nodes: nodes,
        }
    },
    mounted: function () {
        const diagramInstance = this.$refs.diagram.ej2Instances;
        diagramInstance.nodes[0].shape.header.style.fill = 'red'
        diagramInstance.dataBind();
    }
}
</script>
<style>
@import "../node_modules/@syncfusion/ej2-vue-diagrams/styles/material.css";
</style>

Header editing

Diagram provides the support to edit swimlane headers at runtime. We achieve the header editing by double click event. Double clicking the header label will enables the editing of that.

The following image illustrates how to edit the swimlane header. Header Editing

Lanes

Lane is a functional unit or a responsible department of a business process that helps to map a process within the functional unit or in between other functional units.

The number of lanes can be added to swimlane. The lanes are automatically stacked inside swimlane based on the order they are added.

Create an empty lane

  • The lanes id is used to define the name of the lane and its further used to find the lane at runtime and do any customization.

  • We can provide additional information to the lane by using the addInfo property of the lane.

The following code example illustrates how to define a swimlane with lane.

<template>
    <div id="app">
        <ejs-diagram id="diagram" :width='width' :height='height' :nodes='nodes'></ejs-diagram>
    </div>
</template>
<script setup>
import { DiagramComponent as EjsDiagram } from '@syncfusion/ej2-vue-diagrams';

const nodes = [{
    shape: {
        type: 'SwimLane',
        orientation: 'Horizontal',
        header: {
            annotation: { content: 'ONLINE PURCHASE STATUS', style: { fill: '#111111' } },
            height: 50, style: { fontSize: 11 },
        },
        // initialize the lane of swimlane
        lanes: [
            {
                id: 'stackCanvas1',
                // set the lane height
                height: 100,
                // set the lane info
                addInfo: { name: 'lane1' }
            },
        ],
        phases: [
            {
                id: 'phase1', offset: 170,
                header: { annotation: { content: 'Phase' } }
            },
        ],
        phaseSize: 20,
    },
    offsetX: 300, offsetY: 200,
    height: 200,
    width: 350
}];

const width = "100%";
const height = "350px";

</script>
<style>
@import "../node_modules/@syncfusion/ej2-vue-diagrams/styles/material.css";
</style>
<template>
    <div id="app">
        <ejs-diagram id="diagram" :width='width' :height='height' :nodes='nodes'></ejs-diagram>
    </div>
</template>
<script>
import { DiagramComponent } from '@syncfusion/ej2-vue-diagrams';

let nodes = [{
    shape: {
        type: 'SwimLane',
        orientation: 'Horizontal',
        header: {
            annotation: { content: 'ONLINE PURCHASE STATUS', style: { fill: '#111111' } },
            height: 50, style: { fontSize: 11 },
        },
        // initialize the lane of swimlane
        lanes: [
            {
                id: 'stackCanvas1',
                // set the lane height
                height: 100,
                // set the lane info
                addInfo: { name: 'lane1' }
            },
        ],
        phases: [
            {
                id: 'phase1', offset: 170,
                header: { annotation: { content: 'Phase' } }
            },
        ],
        phaseSize: 20,
    },
    offsetX: 300, offsetY: 200,
    height: 200,
    width: 350
}];

export default {
    name: "App",
    components: {
        "ejs-diagram": DiagramComponent
    },
    data() {
        return {
            width: "100%",
            height: "350px",
            nodes: nodes,
        }
    }
}
</script>
<style>
@import "../node_modules/@syncfusion/ej2-vue-diagrams/styles/material.css";
</style>

Create lane header

  • The header property of lane allows you to textually describe the lane and to customize the appearance of the description.

The following code example illustrates how to define a lane header.

<template>
    <div id="app">
        <ejs-diagram id="diagram" :width='width' :height='height' :nodes='nodes'></ejs-diagram>
    </div>
</template>
<script setup>
import { DiagramComponent as EjsDiagram } from '@syncfusion/ej2-vue-diagrams';

const nodes = [{
    shape: {
        type: 'SwimLane',
        orientation: 'Horizontal',
        // Intialize header to swimlane
        header: {
            annotation: { content: 'ONLINE PURCHASE STATUS', style: { fill: '#111111' } },
            height: 50, style: { fontSize: 11 },
        },
        // Intialize lane to swimlane
        lanes: [
            {
                id: 'stackCanvas1',
                height: 100,
                // Intialize header to lane
                header: {
                    annotation: { content: 'CUSTOMER' }, width: 50,
                    style: { fontSize: 11 }
                },
            },

        ],
        phases: [
            {
                id: 'phase1', offset: 170,
                header: { annotation: { content: 'Phase' } }
            },
        ],
        phaseSize: 20,
    },
    offsetX: 300, offsetY: 200,
    height: 200,
    width: 350
}];
const width = "100%";
const height = "350px";

</script>
<style>
@import "../node_modules/@syncfusion/ej2-vue-diagrams/styles/material.css";
</style>
<template>
    <div id="app">
        <ejs-diagram id="diagram" :width='width' :height='height' :nodes='nodes'></ejs-diagram>
    </div>
</template>
<script>
import { DiagramComponent } from '@syncfusion/ej2-vue-diagrams';

let nodes = [{
    shape: {
        type: 'SwimLane',
        orientation: 'Horizontal',
        // Intialize header to swimlane
        header: {
            annotation: { content: 'ONLINE PURCHASE STATUS', style: { fill: '#111111' } },
            height: 50, style: { fontSize: 11 },
        },
        // Intialize lane to swimlane
        lanes: [
            {
                id: 'stackCanvas1',
                height: 100,
                // Intialize header to lane
                header: {
                    annotation: { content: 'CUSTOMER' }, width: 50,
                    style: { fontSize: 11 }
                },
            },

        ],
        phases: [
            {
                id: 'phase1', offset: 170,
                header: { annotation: { content: 'Phase' } }
            },
        ],
        phaseSize: 20,
    },
    offsetX: 300, offsetY: 200,
    height: 200,
    width: 350
}];

export default {
    name: "App",
    components: {
        "ejs-diagram": DiagramComponent
    },
    data() {
        return {
            width: "100%",
            height: "350px",
            nodes: nodes
        }
    }
}
</script>
<style>
@import "../node_modules/@syncfusion/ej2-vue-diagrams/styles/material.css";
</style>

Customizing lane header

  • The size of lane can be controlled by using the width and height properties of the lane.
  • The appearance of the lane can be set by using the style properties.

The following code example illustrates how to customize the lane header.

<template>
    <div id="app">
        <ejs-diagram id="diagram" :width='width' :height='height' :nodes='nodes'></ejs-diagram>
    </div>
</template>
<script setup>

import { DiagramComponent as EjsDiagram } from '@syncfusion/ej2-vue-diagrams';

const nodes = [{
    shape: {
        type: 'SwimLane',
        orientation: 'Horizontal',
        //Intialize header to swimlane
        header: {
            annotation: { content: 'ONLINE PURCHASE STATUS', style: { fill: '#111111' } },
            height: 50, style: { fontSize: 11 },
        },
        lanes: [
            {
                id: 'stackCanvas1',
                height: 100,
                // customization of lane header
                header: {
                    annotation: { content: 'Online Consumer' }, width: 30,
                    style: { fontSize: 11 }, style: { fill: 'red' }
                },
            },
        ],
        phases: [
            {
                id: 'phase1', offset: 170,
                header: { annotation: { content: 'Phase' } }
            },
        ],
        phaseSize: 20,
    },
    offsetX: 300, offsetY: 200,
    height: 200,
    width: 350
}];

const width = "100%";
const height = "350px";

</script>
<style>
@import "../node_modules/@syncfusion/ej2-vue-diagrams/styles/material.css";
</style>
<template>
    <div id="app">
        <ejs-diagram id="diagram" :width='width' :height='height' :nodes='nodes'></ejs-diagram>
    </div>
</template>
<script>
import { DiagramComponent } from '@syncfusion/ej2-vue-diagrams';

let nodes = [{
    shape: {
        type: 'SwimLane',
        orientation: 'Horizontal',
        //Intialize header to swimlane
        header: {
            annotation: { content: 'ONLINE PURCHASE STATUS', style: { fill: '#111111' } },
            height: 50, style: { fontSize: 11 },
        },
        lanes: [
            {
                id: 'stackCanvas1',
                height: 100,
                // customization of lane header
                header: {
                    annotation: { content: 'Online Consumer' }, width: 30,
                    style: { fontSize: 11 }, style: { fill: 'red' }
                },
            },
        ],
        phases: [
            {
                id: 'phase1', offset: 170,
                header: { annotation: { content: 'Phase' } }
            },
        ],
        phaseSize: 20,
    },
    offsetX: 300, offsetY: 200,
    height: 200,
    width: 350
}];

export default {
    name: "App",
    components: {
        "ejs-diagram": DiagramComponent
    },
    data() {
        return {
            width: "100%",
            height: "350px",
            nodes: nodes,
        }
    }
}
</script>
<style>
@import "../node_modules/@syncfusion/ej2-vue-diagrams/styles/material.css";
</style>

Dynamic customization of lane header

You can customize the lane header style and text properties dynamically. The following code illustrates how to dynamically customize the lane header.

<template>
    <div id="app">
        <ejs-diagram id="diagram" ref="diagram" :width='width' :height='height' :nodes='nodes'></ejs-diagram>
    </div>
</template>
<script setup>
import { onMounted, ref } from "vue";
import { DiagramComponent as EjsDiagram } from '@syncfusion/ej2-vue-diagrams';

const diagram = ref(null);
const nodes = [{
    shape: {
        type: 'SwimLane',
        orientation: 'Horizontal',
        //Intialize header to swimlane
        header: {
            annotation: { content: 'ONLINE PURCHASE STATUS', style: { fill: '#111111' } },
            height: 50, style: { fontSize: 11 },
        },
        lanes: [
            {
                id: 'stackCanvas1',
                height: 100,
                // customization of lane header
                header: {
                    annotation: { content: 'Online Consumer' }, width: 30,
                    style: { fontSize: 11 }, style: { fill: 'red' }
                },
            },
        ],
        phases: [
            {
                id: 'phase1', offset: 170,
                header: { annotation: { content: 'Phase' } }
            },
        ],
        phaseSize: 20,
    },
    offsetX: 300, offsetY: 200,
    height: 200,
    width: 350
}];
const width = "100%";
const height = "350px";

onMounted(function () {
    const diagramInstance = diagram.value.ej2Instances;
    let lane = diagramInstance.nodes[0];
    lane.shape.lanes[0].header.style.fill = 'red';
    diagramInstance.dataBind();
});

</script>
<style>
@import "../node_modules/@syncfusion/ej2-vue-diagrams/styles/material.css";
</style>
<template>
    <div id="app">
        <ejs-diagram id="diagram" ref="diagram" :width='width' :height='height' :nodes='nodes'></ejs-diagram>
    </div>
</template>
<script>
import { DiagramComponent } from '@syncfusion/ej2-vue-diagrams';

const nodes = [{
    shape: {
        type: 'SwimLane',
        orientation: 'Horizontal',
        //Intialize header to swimlane
        header: {
            annotation: { content: 'ONLINE PURCHASE STATUS', style: { fill: '#111111' } },
            height: 50, style: { fontSize: 11 },
        },
        lanes: [
            {
                id: 'stackCanvas1',
                height: 100,
                // customization of lane header
                header: {
                    annotation: { content: 'Online Consumer' }, width: 30,
                    style: { fontSize: 11 }, style: { fill: 'red' }
                },
            },
        ],
        phases: [
            {
                id: 'phase1', offset: 170,
                header: { annotation: { content: 'Phase' } }
            },
        ],
        phaseSize: 20,
    },
    offsetX: 300, offsetY: 200,
    height: 200,
    width: 350
}];

export default {
    name: "App",
    components: {
        "ejs-diagram": DiagramComponent
    },
    data() {
        return {
            width: "100%",
            height: "350px",
            nodes: nodes,
        }
    },
    mounted: function () {
        const diagramInstance = this.$refs.diagram.ej2Instances;
        let lane = diagramInstance.nodes[0];
        lane.shape.lanes[0].header.style.fill = 'red';
        diagramInstance.dataBind();
    }
}
</script>
<style>
@import "../node_modules/@syncfusion/ej2-vue-diagrams/styles/material.css";
</style>

Add lane at runtime

You can add the a lane at runtime by using the client side API method called addLanes.The following code illustrates how to dynamically add lane to swimlane.

<template>
    <div id="app">
        <ejs-diagram id="diagram" ref="diagram" :width='width' :height='height' :nodes='nodes'></ejs-diagram>
    </div>
</template>
<script setup>
import { onMounted, ref } from "vue";
import { DiagramComponent as EjsDiagram } from '@syncfusion/ej2-vue-diagrams';

const diagram = ref(null);
const nodes = [{
    shape: {
        type: 'SwimLane',
        orientation: 'Horizontal',
        //Intialize header to swimlane
        header: {
            annotation: { content: 'ONLINE PURCHASE STATUS', style: { fill: '#111111' } },
            height: 50, style: { fontSize: 11 },
        },
        lanes: [
            {
                id: 'stackCanvas1',
                height: 100,
                // customization of lane header
                header: {
                    annotation: { content: 'Online Consumer' }, width: 30,
                    style: { fontSize: 11 }, style: { fill: 'red' }
                },
            },
        ],
        phases: [
            {
                id: 'phase1', offset: 170,
                header: { annotation: { content: 'Phase' } }
            },
        ],
        phaseSize: 20,
    },
    offsetX: 300, offsetY: 200,
    height: 200,
    width: 350
}];

const width = "100%";
const height = "350px";

onMounted(function () {
    const diagramInstance = diagram.value.ej2Instances;
    let lane = [{ id: "lane1", height: 100, }];
    diagramInstance.addLanes(diagramInstance.nodes[0], lane, 1);
})
</script>
<style>
@import "../node_modules/@syncfusion/ej2-vue-diagrams/styles/material.css";
</style>
<template>
    <div id="app">
        <ejs-diagram id="diagram" ref="diagram" :width='width' :height='height' :nodes='nodes'></ejs-diagram>
    </div>
</template>
<script>
import { DiagramComponent } from '@syncfusion/ej2-vue-diagrams';

const nodes = [{
    shape: {
        type: 'SwimLane',
        orientation: 'Horizontal',
        //Intialize header to swimlane
        header: {
            annotation: { content: 'ONLINE PURCHASE STATUS', style: { fill: '#111111' } },
            height: 50, style: { fontSize: 11 },
        },
        lanes: [
            {
                id: 'stackCanvas1',
                height: 100,
                // customization of lane header
                header: {
                    annotation: { content: 'Online Consumer' }, width: 30,
                    style: { fontSize: 11 }, style: { fill: 'red' }
                },
            },
        ],
        phases: [
            {
                id: 'phase1', offset: 170,
                header: { annotation: { content: 'Phase' } }
            },
        ],
        phaseSize: 20,
    },
    offsetX: 300, offsetY: 200,
    height: 200,
    width: 350
}];

export default {
    name: "App",
    components: {
        "ejs-diagram": DiagramComponent
    },
    data() {
        return {
            width: "100%",
            height: "350px",
            nodes: nodes,
        }
    },
    mounted: function () {
        const diagramInstance = this.$refs.diagram.ej2Instances;
        let lane = [{ id: "lane1", height: 100, }];
        diagramInstance.addLanes(diagramInstance.nodes[0], lane, 1);
    }
}
</script>
<style>
@import "../node_modules/@syncfusion/ej2-vue-diagrams/styles/material.css";
</style>

Add children to lane

To add nodes to lane,you should add children collection of the lane.

The following code example illustrates how to add nodes to lane.

<template>
    <div id="app">
        <ejs-diagram id="diagram" :width='width' :height='height' :nodes='nodes'></ejs-diagram>
    </div>
</template>
<script setup>
import { DiagramComponent as EjsDiagram } from '@syncfusion/ej2-vue-diagrams';

const nodes = [{
    shape: {
        type: 'SwimLane',
        orientation: 'Horizontal',
        // Intialize header to swimlane
        header: {
            annotation: { content: 'ONLINE PURCHASE STATUS', style: { fill: '#111111' } },
            height: 50, style: { fontSize: 11 },
        },
        lanes: [
            {
                id: 'stackCanvas1',
                height: 100,
                header: {
                    annotation: { content: 'CUSTOMER' }, width: 50,
                    style: { fontSize: 11 }
                },
                // Set the childern of lane
                children: [
                    {
                        id: 'node1',
                        annotations: [
                            {
                                content: 'Consumer learns \n of product',
                                style: { fontSize: 11 }
                            }
                        ],
                        margin: { left: 60, top: 30 },
                        height: 40, width: 100,
                    }, {
                        id: 'node2',
                        shape: { type: 'Flow', shape: 'Decision' },
                        annotations: [
                            {
                                content: 'Does \n Consumer want \nthe product',
                                style: { fontSize: 11 }
                            }
                        ],
                        margin: { left: 200, top: 20 },
                        height: 60, width: 120,
                    },
                ],
            },

        ],
        phases: [
            {
                id: 'phase1', offset: 170,
                header: { annotation: { content: 'Phase' } }
            },
        ],
        phaseSize: 20,
    },
    offsetX: 300, offsetY: 200,
    height: 200,
    width: 350
}]

const width = "100%";
const height = "350px";

</script>
<style>
@import "../node_modules/@syncfusion/ej2-vue-diagrams/styles/material.css";
</style>
<template>
    <div id="app">
        <ejs-diagram id="diagram" :width='width' :height='height' :nodes='nodes'></ejs-diagram>
    </div>
</template>
<script>
import { DiagramComponent } from '@syncfusion/ej2-vue-diagrams';

let nodes = [{
    shape: {
        type: 'SwimLane',
        orientation: 'Horizontal',
        // Intialize header to swimlane
        header: {
            annotation: { content: 'ONLINE PURCHASE STATUS', style: { fill: '#111111' } },
            height: 50, style: { fontSize: 11 },
        },
        lanes: [
            {
                id: 'stackCanvas1',
                height: 100,
                header: {
                    annotation: { content: 'CUSTOMER' }, width: 50,
                    style: { fontSize: 11 }
                },
                // Set the childern of lane
                children: [
                    {
                        id: 'node1',
                        annotations: [
                            {
                                content: 'Consumer learns \n of product',
                                style: { fontSize: 11 }
                            }
                        ],
                        margin: { left: 60, top: 30 },
                        height: 40, width: 100,
                    }, {
                        id: 'node2',
                        shape: { type: 'Flow', shape: 'Decision' },
                        annotations: [
                            {
                                content: 'Does \n Consumer want \nthe product',
                                style: { fontSize: 11 }
                            }
                        ],
                        margin: { left: 200, top: 20 },
                        height: 60, width: 120,
                    },
                ],
            },

        ],
        phases: [
            {
                id: 'phase1', offset: 170,
                header: { annotation: { content: 'Phase' } }
            },
        ],
        phaseSize: 20,
    },
    offsetX: 300, offsetY: 200,
    height: 200,
    width: 350
}];

export default {
    name: "App",
    components: {
        "ejs-diagram": DiagramComponent
    },
    data() {
        return {
            width: "100%",
            height: "350px",
            nodes: nodes,
        }
    }
}
</script>
<style>
@import "../node_modules/@syncfusion/ej2-vue-diagrams/styles/material.css";
</style>

Lane interaction

Resizing lane

  • Lane can be resized in the bottom and left direction.
  • Lane can be resized by using resize selector of the lane.
  • Once you can resize the lane,the swimlane will be resized automatically.
  • The lane can be resized either resizing the selector or the tight bounds of the child object. If the child node move to edge of the lane it can be automatically resized.
    The following image illustrates how resize the lane.
    Lane Resizing

Lane swapping

  • Lanes can be swapped using drag the lanes over another lane.
  • Helper should intimate the insertion point while lane swapping.
    The following image illustrates how swapping the lane. Lane Swapping

Disable Swimlane Lane swapping

You can disable swimlane lane swapping by using the property called canMove.

The following code illustrates how to disable swimlane lane swapping.

<template>
    <div id="app">
        <ejs-diagram id="diagram" ref="diagram" :width='width' :height='height' :nodes='nodes'></ejs-diagram>
    </div>
</template>
<script setup>
import { onMounted, ref } from "vue";
import { DiagramComponent as EjsDiagram } from '@syncfusion/ej2-vue-diagrams';

const diagram = ref(null);
const nodes = [{
    shape: {
        type: 'SwimLane',
        orientation: 'Horizontal',
        //Intialize header to swimlane
        header: {
            annotation: { content: 'ONLINE PURCHASE STATUS', style: { fill: '#111111' } },
            height: 50, style: { fontSize: 11 },
        },
        lanes: [
            {
                id: 'stackCanvas1',
                height: 100,
                // customization of lane header
                header: {
                    annotation: { content: 'Online Consumer' }, width: 30,
                    style: { fontSize: 11, fill: 'red' }
                },
                canMove: false,
            },
        ],
        phases: [
            {
                id: 'phase1', offset: 170,
                header: { annotation: { content: 'Phase' } }
            },
        ],
        phaseSize: 20,
    },
    offsetX: 300, offsetY: 200,
    height: 200,
    width: 350
}];

const width = "100%";
const height = "350px";

onMounted(function () {
    const diagramInstance = diagram.value.ej2Instances;
    let lane = [{ id: "lane1", height: 100, canMove: false }];
    diagramInstance.addLanes(diagramInstance.nodes[0], lane, 1);
});
</script>
<style>
@import "../node_modules/@syncfusion/ej2-vue-diagrams/styles/material.css";
</style>
<template>
    <div id="app">
        <ejs-diagram id="diagram" ref="diagram" :width='width' :height='height' :nodes='nodes'></ejs-diagram>
    </div>
</template>
<script>
import { DiagramComponent } from '@syncfusion/ej2-vue-diagrams';

let nodes = [{
    shape: {
        type: 'SwimLane',
        orientation: 'Horizontal',
        //Intialize header to swimlane
        header: {
            annotation: { content: 'ONLINE PURCHASE STATUS', style: { fill: '#111111' } },
            height: 50, style: { fontSize: 11 },
        },
        lanes: [
            {
                id: 'stackCanvas1',
                height: 100,
                // customization of lane header
                header: {
                    annotation: { content: 'Online Consumer' }, width: 30,
                    style: { fontSize: 11, fill: 'red' }
                },
                canMove: false,
            },
        ],
        phases: [
            {
                id: 'phase1', offset: 170,
                header: { annotation: { content: 'Phase' } }
            },
        ],
        phaseSize: 20,
    },
    offsetX: 300, offsetY: 200,
    height: 200,
    width: 350
}];

export default {
    name: "App",
    components: {
        "ejs-diagram": DiagramComponent
    },
    data() {
        return {
            width: "100%",
            height: "350px",
            nodes: nodes,
        }
    },
    mounted: function () {
        const diagramInstance = this.$refs.diagram.ej2Instances;
        let lane = [{ id: "lane1", height: 100, canMove: false }];
        diagramInstance.addLanes(diagramInstance.nodes[0], lane, 1);
    }
}
</script>
<style>
@import "../node_modules/@syncfusion/ej2-vue-diagrams/styles/material.css";
</style>

Resize helper

  • The special resize helper will be used to resize the lanes.
  • The resize cursor will be available on the left and bottom direction alone.
  • Once resize the lane the swimlane will be resized automatically.

Children interaction in lanes

  • You can resize the child node within swimlanes.
  • You can drag the child nodes within lane.
  • Interchange the child nodes from one lane to another lane.
  • Drag and drop the child nodes from lane to diagram.
  • Drag and drop the child nodes from diagram to lane.
  • Based on the child node interactions,the lane size should be updated.
    The following image illustrates children interaction in lane.
    Lane Children Interaction

Lane header editing

Diagram provides the support to edit Lane headers at runtime. We achieve the header editing by double click event. Double clicking the header label will enables the editing of that.
The following image illustrates how to edit the swimlane header.
The following image illustrates how to edit the lane header.
Lane Header Editing

Phase

Phase are the subprocess which will split each lane as horizontally or vertically based on the swimlane orientation. The multiple number of Phase can be added to swimlane.
The following code example illustrates how to add phase at swimlane.

<template>
    <div id="app">
        <ejs-diagram id="diagram" :width='width' :height='height' :nodes='nodes'></ejs-diagram>
    </div>
</template>
<script setup>
import { DiagramComponent as EjsDiagram } from '@syncfusion/ej2-vue-diagrams';

const nodes = [{
    shape: {
        type: 'SwimLane',
        orientation: 'Horizontal',
        //Intialize header to swimlane
        header: {
            annotation: { content: 'ONLINE PURCHASE STATUS', style: { fill: '#111111' } },
            height: 50, style: { fontSize: 11 },
        },
        lanes: [
            {
                id: 'stackCanvas1',
                height: 100,
                header: {
                    annotation: { content: 'CUSTOMER' }, width: 50,
                    style: { fontSize: 11 }
                },
                children: [
                    {
                        id: 'node1',
                        annotations: [
                            {
                                content: 'Consumer learns \n of product',
                                style: { fontSize: 11 }
                            }
                        ],
                        margin: { left: 60, top: 30 },
                        height: 40, width: 100,
                    }, {
                        id: 'node2',
                        shape: { type: 'Flow', shape: 'Decision' },
                        annotations: [
                            {
                                content: 'Does \n Consumer want \nthe product',
                                style: { fontSize: 11 }
                            }
                        ],
                        margin: { left: 200, top: 20 },
                        height: 60, width: 120,
                    },
                ],
            },

        ],
        // Set phase to swimlane
        phases: [
            {
                id: 'phase1', offset: 120,
                header: { annotation: { content: 'Phase' } }
            }, {
                id: 'phase2', offset: 200,
                header: { annotation: { content: 'Phase' } }
            },
        ],
        phaseSize: 20,
    },
    offsetX: 300, offsetY: 200,
    height: 200,
    width: 350
}];
const width = "100%";
const height = "350px";
</script>
<style>
@import "../node_modules/@syncfusion/ej2-vue-diagrams/styles/material.css";
</style>
<template>
    <div id="app">
        <ejs-diagram id="diagram" :width='width' :height='height' :nodes='nodes'></ejs-diagram>
    </div>
</template>
<script>
import { DiagramComponent } from '@syncfusion/ej2-vue-diagrams';

let nodes = [{
    shape: {
        type: 'SwimLane',
        orientation: 'Horizontal',
        //Intialize header to swimlane
        header: {
            annotation: { content: 'ONLINE PURCHASE STATUS', style: { fill: '#111111' } },
            height: 50, style: { fontSize: 11 },
        },
        lanes: [
            {
                id: 'stackCanvas1',
                height: 100,
                header: {
                    annotation: { content: 'CUSTOMER' }, width: 50,
                    style: { fontSize: 11 }
                },
                children: [
                    {
                        id: 'node1',
                        annotations: [
                            {
                                content: 'Consumer learns \n of product',
                                style: { fontSize: 11 }
                            }
                        ],
                        margin: { left: 60, top: 30 },
                        height: 40, width: 100,
                    }, {
                        id: 'node2',
                        shape: { type: 'Flow', shape: 'Decision' },
                        annotations: [
                            {
                                content: 'Does \n Consumer want \nthe product',
                                style: { fontSize: 11 }
                            }
                        ],
                        margin: { left: 200, top: 20 },
                        height: 60, width: 120,
                    },
                ],
            },

        ],
        // Set phase to swimlane
        phases: [
            {
                id: 'phase1', offset: 120,
                header: { annotation: { content: 'Phase' } }
            }, {
                id: 'phase2', offset: 200,
                header: { annotation: { content: 'Phase' } }
            },
        ],
        phaseSize: 20,
    },
    offsetX: 300, offsetY: 200,
    height: 200,
    width: 350
}];

export default {
    name: "App",
    components: {
        "ejs-diagram": DiagramComponent
    },
    data() {
        return {
            width: "100%",
            height: "350px",
            nodes: nodes,
        }
    }
}
</script>
<style>
@import "../node_modules/@syncfusion/ej2-vue-diagrams/styles/material.css";
</style>

Dynamically add phase to lane

You can add the a phase at runtime by using client side API method called addPhases. The following code example illustrates how to add phase at run time.

<template>
    <div id="app">
        <ejs-diagram id="diagram" ref="diagram" :width='width' :height='height' :nodes='nodes'></ejs-diagram>
    </div>
</template>
<script setup>
import { onMounted, ref } from "vue";
import { DiagramComponent as EjsDiagram } from '@syncfusion/ej2-vue-diagrams';

const diagram = ref(null);
const nodes = [{
    shape: {
        type: 'SwimLane',
        orientation: 'Horizontal',
        //Intialize header to swimlane
        header: {
            annotation: { content: 'ONLINE PURCHASE STATUS', style: { fill: '#111111' } },
            height: 50, style: { fontSize: 11 },
        },
        lanes: [
            {
                id: 'stackCanvas1',
                height: 100,
                // customization of lane header
                header: {
                    annotation: { content: 'Online Consumer' }, width: 30,
                    style: { fontSize: 11 }, style: { fill: 'red' }
                },
            },
        ],
        phases: [
            {
                id: 'phase1', offset: 170,
                header: { annotation: { content: 'Phase' } }
            },
        ],
        phaseSize: 20,
    },
    offsetX: 300, offsetY: 200,
    height: 200,
    width: 350
}];

const width = "100%";
const height = "350px";

onMounted(function () {
    const diagramInstance = diagram.value.ej2Instances;
    let phase = [{
        id: 'phase3', offset: 220,
        header: { annotation: { content: 'Phase' } }
    }]
    diagramInstance.addPhases(diagramInstance.nodes[0], phase);
})
</script>
<style>
@import "../node_modules/@syncfusion/ej2-vue-diagrams/styles/material.css";
</style>
<template>
    <div id="app">
        <ejs-diagram id="diagram" ref="diagram" :width='width' :height='height' :nodes='nodes'></ejs-diagram>
    </div>
</template>
<script>
import { DiagramComponent } from '@syncfusion/ej2-vue-diagrams';

let nodes = [{
    shape: {
        type: 'SwimLane',
        orientation: 'Horizontal',
        //Intialize header to swimlane
        header: {
            annotation: { content: 'ONLINE PURCHASE STATUS', style: { fill: '#111111' } },
            height: 50, style: { fontSize: 11 },
        },
        lanes: [
            {
                id: 'stackCanvas1',
                height: 100,
                // customization of lane header
                header: {
                    annotation: { content: 'Online Consumer' }, width: 30,
                    style: { fontSize: 11 }, style: { fill: 'red' }
                },
            },
        ],
        phases: [
            {
                id: 'phase1', offset: 170,
                header: { annotation: { content: 'Phase' } }
            },
        ],
        phaseSize: 20,
    },
    offsetX: 300, offsetY: 200,
    height: 200,
    width: 350
}];

export default {
    name: "App",
    components: {
        "ejs-diagram": DiagramComponent
    },
    data() {
        return {
            width: "100%",
            height: "350px",
            nodes: nodes,
        }
    },
    mounted: function () {
        const diagramInstance = this.$refs.diagram.ej2Instances;
        let phase = [{
            id: 'phase3', offset: 220,
            header: { annotation: { content: 'Phase' } }
        }]
        diagramInstance.addPhases(diagramInstance.nodes[0], phase);
    }
}
</script>
<style>
@import "../node_modules/@syncfusion/ej2-vue-diagrams/styles/material.css";
</style>

Customizing phase

  • The length of region can be set by using the offset property of the phase.
  • Every phase region can be textually described with the header property of the phase
  • You can increase the width of phase by using phaseSize property of swimlane.
  • We can provide additional information to the phase by using the addInfo property of the phase.

The following code example illustrates how to customize the phase in swimlane.

<template>
    <div id="app">
        <ejs-diagram id="diagram" :width='width' :height='height' :nodes='nodes'></ejs-diagram>
    </div>
</template>
<script setup>
import { DiagramComponent as EjsDiagram } from '@syncfusion/ej2-vue-diagrams';

const nodes = [{
    shape: {
        type: 'SwimLane',
        orientation: 'Horizontal',
        //Intialize header to swimlane
        header: {
            annotation: { content: 'ONLINE PURCHASE STATUS', style: { fill: '#111111' } },
            height: 50, style: { fontSize: 11 },
        },
        lanes: [
            {
                id: 'stackCanvas1',
                height: 100,
                header: {
                    annotation: { content: 'CUSTOMER' }, width: 50,
                    style: { fontSize: 11 }
                },
                children: [
                    {
                        id: 'node1',
                        annotations: [
                            {
                                content: 'Consumer learns \n of product',
                                style: { fontSize: 11 }
                            }
                        ],
                        margin: { left: 60, top: 30 },
                        height: 40, width: 100,
                    }, {
                        id: 'node2',
                        shape: { type: 'Flow', shape: 'Decision' },
                        annotations: [
                            {
                                content: 'Does \n Consumer want \nthe product',
                                style: { fontSize: 11 }
                            }
                        ],
                        margin: { left: 200, top: 20 },
                        height: 60, width: 120,
                    },
                ],
            },

        ],
        phases: [
            {
                id: 'phase1', offset: 120,
                // set the phase info
                addInfo: { name: 'phase1' },
                header: { annotation: { content: 'Phase' } }, style: { fill: 'red' }
            }, {
                id: 'phase2', offset: 200,
                header: { annotation: { content: 'Phase' } }
            },
        ],
        phaseSize: 20,
    },
    offsetX: 300, offsetY: 200,
    height: 200,
    width: 350
}];

const width = "100%";
const height = "350px";

</script>
<style>
@import "../node_modules/@syncfusion/ej2-vue-diagrams/styles/material.css";
</style>
<template>
    <div id="app">
        <ejs-diagram id="diagram" :width='width' :height='height' :nodes='nodes'></ejs-diagram>
    </div>
</template>
<script>
import { DiagramComponent } from '@syncfusion/ej2-vue-diagrams';

let nodes = [{
    shape: {
        type: 'SwimLane',
        orientation: 'Horizontal',
        //Intialize header to swimlane
        header: {
            annotation: { content: 'ONLINE PURCHASE STATUS', style: { fill: '#111111' } },
            height: 50, style: { fontSize: 11 },
        },
        lanes: [
            {
                id: 'stackCanvas1',
                height: 100,
                header: {
                    annotation: { content: 'CUSTOMER' }, width: 50,
                    style: { fontSize: 11 }
                },
                children: [
                    {
                        id: 'node1',
                        annotations: [
                            {
                                content: 'Consumer learns \n of product',
                                style: { fontSize: 11 }
                            }
                        ],
                        margin: { left: 60, top: 30 },
                        height: 40, width: 100,
                    }, {
                        id: 'node2',
                        shape: { type: 'Flow', shape: 'Decision' },
                        annotations: [
                            {
                                content: 'Does \n Consumer want \nthe product',
                                style: { fontSize: 11 }
                            }
                        ],
                        margin: { left: 200, top: 20 },
                        height: 60, width: 120,
                    },
                ],
            },

        ],
        phases: [
            {
                id: 'phase1', offset: 120,
                // set the phase info
                addInfo: { name: 'phase1' },
                header: { annotation: { content: 'Phase' } }, style: { fill: 'red' }
            }, {
                id: 'phase2', offset: 200,
                header: { annotation: { content: 'Phase' } }
            },
        ],
        phaseSize: 20,
    },
    offsetX: 300, offsetY: 200,
    height: 200,
    width: 350
}]
export default {
    name: "App",
    components: {
        "ejs-diagram": DiagramComponent
    },
    data() {
        return {
            width: "100%",
            height: "350px",
            nodes: nodes,
        }
    }
}
</script>
<style>
@import "../node_modules/@syncfusion/ej2-vue-diagrams/styles/material.css";
</style>

Phase interaction

Resizing

  • The phase can be resized by using its selector.
  • You must select the phase header to enable the phase selection.
  • Once the phase can be resized, the lane size will be updated automatically.

Resizing helper

  • The special resize selector will be used to resize the phase.
  • The resize cursor will be available on the left and bottom direction for horizontal, and the top and bottom direction for vertical swimlane.

Phase header editing

Diagram provides the support to edit phase headers at runtime. We achieve the header editing by double click event. Double clicking the header label will enables the editing of that.
The following image illustrates how to edit the swimlane header.
The following image illustrates how to edit the phase header. Phase Header Editing

Add swimlane to palette

Diagram provides support to add swimlane and phases to symbol palette. The following code sample illustrate how to add swimlane and phases to palette.

The following code example illustrates how to customize the phase in swimlane.

<template>
    <div id="app">
        <ejs-symbolpalette id="symbolpalette" :expandMode='expandMode' :palettes='palettes'
            :getSymbolInfo='getSymbolInfo' :symbolMargin='symbolMargin' :width='palettewidth'
            :getNodeDefaults='palettegetNodeDefaults' :symbolPreview='symbolPreview' :height='paletteheight'
            :symbolHeight='symbolHeight' :symbolWidth='symbolWidth'>
        </ejs-symbolpalette>
    </div>
</template>
<script setup>

import { SymbolPaletteComponent as EjsSymbolpalette } from '@syncfusion/ej2-vue-diagrams';

const swimlaneShapes = [
    {
        id: 'stackCanvas1',
        shape: {
            type: 'SwimLane', lanes: [
                {
                    id: 'lane1',
                    style: { strokeColor: 'black' }, height: 60, width: 150,
                    header: { width: 50, height: 50, style: { strokeColor: 'black', fontSize: 11 } },
                }
            ],
            orientation: 'Horizontal', isLane: true
        },
        height: 60,
        width: 140,
        offsetX: 70,
        offsetY: 30,
    }, {
        id: 'stackCanvas2',
        shape: {
            type: 'SwimLane',
            lanes: [
                {
                    id: 'lane1',
                    style: { strokeColor: 'black' }, height: 150, width: 60,
                    header: { width: 50, height: 50, style: { strokeColor: 'black', fontSize: 11 } },
                }
            ],
            orientation: 'Vertical', isLane: true
        },
        height: 140,
        width: 60,
        // style: { fill: '#f5f5f5' },
        offsetX: 70,
        offsetY: 30,
    }, {
        id: 'verticalPhase',
        shape: {
            type: 'SwimLane',
            phases: [{ style: { strokeWidth: 1, strokeDashArray: '3,3', strokeColor: '#A9A9A9' }, }],
            annotations: [{ text: '' }],
            orientation: 'Vertical', isPhase: true
        },
        height: 60,
        width: 140
    }, {
        id: 'horizontalPhase',
        shape: {
            type: 'SwimLane',
            phases: [{ style: { strokeWidth: 1, strokeDashArray: '3,3', strokeColor: '#A9A9A9' }, }],
            annotations: [{ text: '' }],
            orientation: 'Horizontal', isPhase: true
        },
        height: 60,
        width: 140
    }
];

//Defines how many palettes can be at expanded mode at a time
const expandMode = "Multiple";
//Defines the palette collection
const palettes = [{
    id: 'swimlane',
    expanded: true,
    symbols: swimlaneShapes,
    title: 'Swimlane Shapes',
    iconCss: 'e-ddb-icons e-basic'
}]
const symbolMargin = {
    left: 15,
    right: 15,
    top: 15,
    bottom: 15
}
const palettegetNodeDefaults = (node) => {
    node.width = 100;
    node.height = 100;
    node.style.strokeColor = '#3A3A3A';
}
const getSymbolInfo = (symbol) => {
    return {
        fit: true
    };
}

const symbolPreview = {
    height: 100,
    width: 100,
    offset: {
        x: 0.5,
        y: 0.5
    }
}
const palettewidth = "100%";
const paletteheight = "700px";
const symbolHeight = 60;
const symbolWidth = 60;
</script>
<style>
@import "../node_modules/@syncfusion/ej2-vue-diagrams/styles/material.css";
</style>
<template>
    <div id="app">
        <ejs-symbolpalette id="symbolpalette" :expandMode='expandMode' :palettes='palettes'
            :getSymbolInfo='getSymbolInfo' :symbolMargin='symbolMargin' :width='palettewidth'
            :getNodeDefaults='palettegetNodeDefaults' :symbolPreview='symbolPreview' :height='paletteheight'
            :symbolHeight='symbolHeight' :symbolWidth='symbolWidth'></ejs-symbolpalette>
    </div>
</template>
<script>

import { SymbolPaletteComponent } from '@syncfusion/ej2-vue-diagrams';

let swimlaneShapes = [
    {
        id: 'stackCanvas1',
        shape: {
            type: 'SwimLane', lanes: [
                {
                    id: 'lane1',
                    style: { strokeColor: 'black' }, height: 60, width: 150,
                    header: { width: 50, height: 50, style: { strokeColor: 'black', fontSize: 11 } },
                }
            ],
            orientation: 'Horizontal', isLane: true
        },
        height: 60,
        width: 140,
        offsetX: 70,
        offsetY: 30,
    }, {
        id: 'stackCanvas2',
        shape: {
            type: 'SwimLane',
            lanes: [
                {
                    id: 'lane1',
                    style: { strokeColor: 'black' }, height: 150, width: 60,
                    header: { width: 50, height: 50, style: { strokeColor: 'black', fontSize: 11 } },
                }
            ],
            orientation: 'Vertical', isLane: true
        },
        height: 140,
        width: 60,
        // style: { fill: '#f5f5f5' },
        offsetX: 70,
        offsetY: 30,
    }, {
        id: 'verticalPhase',
        shape: {
            type: 'SwimLane',
            phases: [{ style: { strokeWidth: 1, strokeDashArray: '3,3', strokeColor: '#A9A9A9' }, }],
            annotations: [{ text: '' }],
            orientation: 'Vertical', isPhase: true
        },
        height: 60,
        width: 140
    }, {
        id: 'horizontalPhase',
        shape: {
            type: 'SwimLane',
            phases: [{ style: { strokeWidth: 1, strokeDashArray: '3,3', strokeColor: '#A9A9A9' }, }],
            annotations: [{ text: '' }],
            orientation: 'Horizontal', isPhase: true
        },
        height: 60,
        width: 140
    }
];

export default {
    name: "App",
    components: {
        "ejs-symbolpalette": SymbolPaletteComponent
    },
    data() {
        return {
            //Defines how many palettes can be at expanded mode at a time
            expandMode: "Multiple",
            //Defines the palette collection
            palettes: [{
                id: 'swimlane',
                expanded: true,
                symbols: swimlaneShapes,
                title: 'Swimlane Shapes',
                iconCss: 'e-ddb-icons e-basic'
            }],
            symbolMargin: {
                left: 15,
                right: 15,
                top: 15,
                bottom: 15
            },
            palettegetNodeDefaults: (node) => {
                node.width = 100;
                node.height = 100;
                node.style.strokeColor = '#3A3A3A';
            },
            getSymbolInfo: (symbol) => {
                return {
                    fit: true
                };
            },
            symbolPreview: {
                height: 100,
                width: 100,
                offset: {
                    x: 0.5,
                    y: 0.5
                }
            },
            palettewidth: "100%",
            paletteheight: "700px",
            symbolHeight: 60,
            symbolWidth: 60,
        };
    }
}
</script>
<style>
@import "../node_modules/@syncfusion/ej2-vue-diagrams/styles/material.css";
</style>

Drag and drop swimlane to palette

  • The drag and drop support for swimlane shapes has been provided.
  • When you drag and drop the lane shape,if the diagram already contains swimlane with the same orientation, the lane will be added and stacked inside a swimlane based on the order. Otherwise, it will be added a new swimlane.
  • The phase will only drop on swimlane shape with same orientation.
    The following image illustrates how to drag symbol from palette.
    Drag Symbol from Palette

Limitations

  • Connectors cannot be canceled when added directly to swimlane. You must initialize the connector through connector collection.
  • We cannot edit the phase line style.