How can I help you?
Getting started with the Vue 3D Circular Chart component in Vue 3
19 Mar 202611 minutes to read
This article shows how to set up a Vite JavaScript project and integrate the Syncfusion® Vue 3D Circular Chart component using either the Composition or Options API.
The Composition API in Vue 3 provides an alternative way to organize and reuse component logic via composition functions.
The Options API is the traditional component format, organizing logic into options such as data, methods, computed, watch, and life cycle hooks.
Prerequisites
System requirements for Syncfusion® Vue UI components
Set up the Vite project
A recommended approach for beginning with Vue is to scaffold a project using Vite. To create a new Vite project, use one of the commands that are specific to either NPM or Yarn.
npm create vite@latestor
yarn create viteUsing one of the above commands will lead you through a short interactive setup:
- Define the project name: We can specify the name of the project directly. Let’s specify the name of the project as
my-projectfor this article.
? Project name: » my-project- Select
Vueas the framework. It will create a Vue 3 project.
? Select a framework: » - Use arrow-keys. Return to submit.
Vanilla
> Vue
  React
  Preact
  Lit
  Svelte
Others- Choose
JavaScriptas the framework variant to build this Vite project using JavaScript and Vue.
? Select a variant: » - Use arrow-keys. Return to submit.
> JavaScript
  TypeScript
  Customize with create-vue ↗
Nuxt ↗- Upon completing the aforementioned steps to create the
my-project, run the following command to install its dependencies:
cd my-project
npm install
or
cd my-project
yarn install
Now that my-project is ready to run with default settings, let’s add Syncfusion® components to the project.
Add Syncfusion® Vue packages
Syncfusion® Vue component packages are available at npmjs.com. To use Syncfusion® Vue components in the project, install the corresponding npm package.
This article uses the Vue 3D Circular Chart component as an example. To use the Vue 3D Circular Chart component in the project, install the @syncfusion/ej2-vue-charts package with:
npm install @syncfusion/ej2-vue-chartsor
yarn add @syncfusion/ej2-vue-chartsNote: npm v5+ saves packages to
dependenciesby default;--saveis not required.
Add Syncfusion® Vue component
Follow the steps below to add the Vue 3D Circular Chart component using the Composition or Options API:
- First, import and register the 3D Circular Chart component and its child directives in the
scriptsection of the src/App.vue file. If you are using the Composition API, add thesetupattribute to thescripttag.
<script setup>
import { provide } from 'vue';
import { CircularChart3DComponent, CircularChart3DSeriesCollectionDirective, CircularChart3DSeriesDirective, PieSeries3D, CircularChartDataLabel3D, CircularChartLegend3D } from "@syncfusion/ej2-vue-charts";
</script><script>
import { CircularChart3DComponent, CircularChart3DSeriesCollectionDirective, CircularChart3DSeriesDirective, PieSeries3D, CircularChartDataLabel3D, CircularChartLegend3D } from '@syncfusion/ej2-vue-charts';
//Component registration
export default {
name: 'App',
components: {
'ejs-circularchart3d' : CircularChart3DComponent,
'e-circularchart3d-series-collection' : CircularChart3DSeriesCollectionDirective,
'e-circularchart3d-series' : CircularChart3DSeriesDirective
}
}
</script>- In the
templatesection, define the 3D Circular Chart component with thedataSourceproperty.
<template>
    <ejs-circularchart3d id="container" :title='title' :tilt='tilt' :legendSettings='legendSettings'>
        <e-circularchart3d-series-collection>
            <e-circularchart3d-series :dataSource='seriesData' xName='x' yName='y' :dataLabel='dataLabel'>
            </e-circularchart3d-series>
        </e-circularchart3d-series-collection>
    </ejs-circularchart3d>
</template>- Declare the values for the
dataSourceproperty in thescriptsection.
<script setup>
let seriesData = [
    { x: 'Chrome', y: 62.92 },
    { x: 'Internet Explorer', y: 6.12 },
    { x: 'Opera', y: 3.15 },
    { x: 'Edge', y: 5.5 },
    { x: 'Safari', y: 19.97 },
    { x: 'Others', y: 2.34 }
];
</script><script>
data() {
return {
seriesData: [
{ x: 'Chrome', y: 62.92 },
{ x: 'Internet Explorer', y: 6.12 },
{ x: 'Opera', y: 3.15 },
{ x: 'Edge', y: 5.5 },
{ x: 'Safari', y: 19.97 },
{ x: 'Others', y: 2.34 }
]
};
}
</script>Here is the summarized code for the above steps in the src/App.vue file:
<template>
  <ejs-circularchart3d
    id="container"
    :title="title"
    :tilt="tilt"
    :legendSettings="legendSettings"
  >
    <e-circularchart3d-series-collection>
      <e-circularchart3d-series
        :dataSource="seriesData"
        xName="x"
        yName="y"
        :dataLabel="dataLabel"
      ></e-circularchart3d-series>
    </e-circularchart3d-series-collection>
  </ejs-circularchart3d>
</template>

<script setup>
import { provide } from 'vue';
import {
  CircularChart3DComponent,
  CircularChart3DSeriesCollectionDirective,
  CircularChart3DSeriesDirective,
  PieSeries3D,
  CircularChartDataLabel3D,
  CircularChartLegend3D
} from "@syncfusion/ej2-vue-charts";

let seriesData = [
  { x: 'Chrome', y: 64.2 },
  { x: 'Safari', y: 18.8 },
  { x: 'Edge', y: 4.9 },
  { x: 'Firefox', y: 3.1 },
  { x: 'Opera', y: 2.4 },
  { x: 'Others', y: 6.6 }
];

let title = 'Browser Market Shares in January 2026';
let tilt = 30; // Milder 3D tilt for better visibility
let legendSettings = { visible: true, position: 'Right' };
let dataLabel = {
  visible: true,
  position: 'Outside',
  font: { fontWeight: '600' },
  connectorStyle: { length: '40px' }
};

provide('circularchart3d', [PieSeries3D, CircularChartDataLabel3D, CircularChartLegend3D]);
</script><template>
<ejs-circularchart3d
id="container"
:title="title"
:tilt="tilt"
:legendSettings="legendSettings"
>
<e-circularchart3d-series-collection>
<e-circularchart3d-series
:dataSource="seriesData"
xName="x"
yName="y"
:dataLabel="dataLabel"
></e-circularchart3d-series>
</e-circularchart3d-series-collection>
</ejs-circularchart3d>
</template>
<script>
import {
CircularChart3DComponent,
CircularChart3DSeriesCollectionDirective,
CircularChart3DSeriesDirective,
PieSeries3D,
CircularChartDataLabel3D,
CircularChartLegend3D
} from "@syncfusion/ej2-vue-charts";
export default {
name: 'App',
components: {
'ejs-circularchart3d': CircularChart3DComponent,
'e-circularchart3d-series-collection': CircularChart3DSeriesCollectionDirective,
'e-circularchart3d-series': CircularChart3DSeriesDirective
},
provide: {
circularchart3d: [PieSeries3D, CircularChartDataLabel3D, CircularChartLegend3D]
},
data() {
return {
seriesData: [
{ x: 'Chrome', y: 64.2 },
{ x: 'Safari', y: 18.8 },
{ x: 'Edge', y: 4.9 },
{ x: 'Firefox', y: 3.1 },
{ x: 'Opera', y: 2.4 },
{ x: 'Others', y: 6.6 }
],
title: 'Browser Market Shares in January 2026',
tilt: 30,
legendSettings: { visible: true, position: 'Right' },
dataLabel: {
visible: true,
position: 'Outside',
font: { fontWeight: '600' },
connectorStyle: { length: '40px' }
}
};
}
};
</script>Run the project
To run the project, use the following command:
npm run devor
yarn run devThe output will appear as follows:
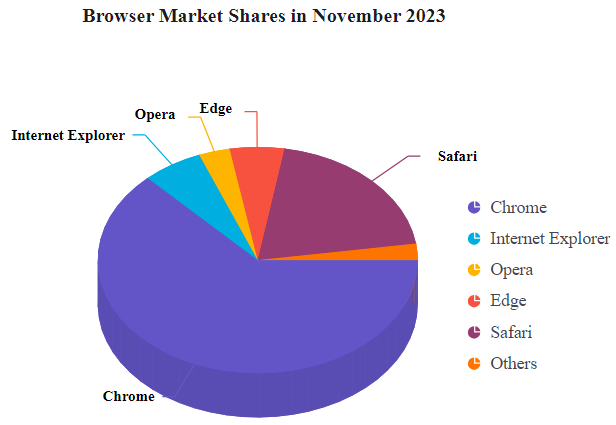
Sample:
vue3-circular-chart-3d-getting-started.
For migrating from Vue 2 to Vue 3, refer to themigrationdocumentation.