How can I help you?
Getting started with React Range Navigator component
28 Feb 202610 minutes to read
This section describes the steps to create a simple Range Navigator and demonstrates the basic usage of the Range Navigator component.
Dependencies
Below is the list of minimum dependencies required to use the Range Navigator component.
|-- @syncfusion/ej2-react-charts
    |-- @syncfusion/ej2-base
    |-- @syncfusion/ej2-data
    |-- @syncfusion/ej2-pdf-export
    |-- @syncfusion/ej2-file-utils
    |-- @syncfusion/ej2-compression
    |-- @syncfusion/ej2-navigations
    |-- @syncfusion/ej2-calendars
    |-- @syncfusion/ej2-svg-base
Installation and configuration
To easily set up a React application, use the Vite CLI (npm create vite), which provides a faster development environment, smaller bundle sizes, and optimized builds compared to traditional tools like create-react-app. For detailed steps, refer to the Vite installation instructions. Vite sets up your environment using JavaScript and optimizes your application for production.
Note: To create a React application using
create-react-appinstead, refer to this documentation for more details.
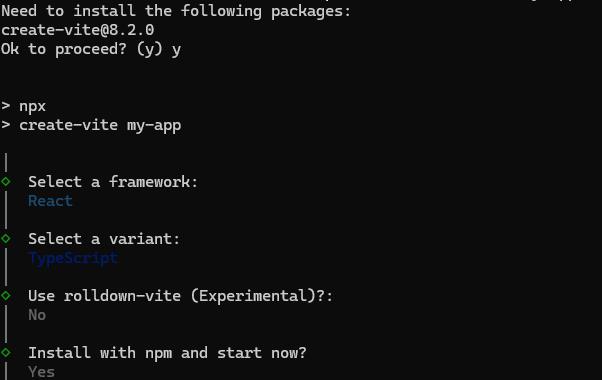
To create a new React application, run the following command.
npm create vite@latest my-appThis command will prompt you for a few settings for the new project, such as selecting a framework and a variant.
To set up a React application in TypeScript environment, run the following command.
npm create vite@latest my-app -- --template react-ts
cd my-app
npm run dev
To set up a React application in JavaScript environment, run the following command.
npm create vite@latest my-app -- --template react
cd my-app
npm run dev
Install Syncfusion® Range Navigator Package
All the available Essential® JS 2 packages are published in the npmjs.com public registry.
To install the Syncfusion® Range Navigator package, use the following command
npm install @syncfusion/ej2-react-charts --saveThe –save will instruct NPM to include the Range Navigator package inside of the dependencies section of the package.json.
Add Range Navigator to the project
Add the Range Navigator component to src/App.tsx using the following code.
import * as React from 'react';
import { RangeNavigatorComponent } from '@syncfusion/ej2-react-charts';

function App() {
  return (<RangeNavigatorComponent></RangeNavigatorComponent>);
}
export default App;
Then, update the src/main.tsx file to render the App component using React 18’s createRoot API.
import React from 'react';
import { createRoot } from 'react-dom/client';
import App from './App';
import './index.css';

const root = createRoot(document.getElementById('root')!);
root.render(
  <React.StrictMode>
    <App />
  </React.StrictMode>
);
Now run the npm run dev command in the console to start the development server. This command compiles your code and serves the application locally, opening it in the browser.
npm run devThe below example shows a basic Range Navigator.
import { RangeNavigatorComponent } from '@syncfusion/ej2-react-charts';
import * as React from "react";
import * as ReactDOM from "react-dom";

function App() {
    return <RangeNavigatorComponent id="charts"/>;
}

export default App;

const root = ReactDOM.createRoot(document.getElementById('charts'));
root.render(<App />);
import { RangeNavigatorComponent } from '@syncfusion/ej2-react-charts';
import * as React from "react";
import * as ReactDOM from "react-dom";
function App() {
return <RangeNavigatorComponent id="charts" />
}
export default App;
const root = ReactDOM.createRoot(document.getElementById('charts'));
root.render(<App />);Module injection
Range Navigator component are segregated into individual feature-wise modules. In order to use a particular feature, you need to inject its feature service in the AppModule. The following services are used to extend Range Navigator’s basic functionality.
-
AreaSeries- Inject this module in toservicesto use area series. -
DateTime- Inject this module in toservicesto use date time feature. -
RangeTooltip- Inject this module in toservicesto use tooltip feature.
Import the above-mentioned modules from the chart package and inject them into the services section of the Range Navigator component as follows.
import { RangeNavigatorComponent, AreaSeries, DateTime, RangeTooltip, Inject } from '@syncfusion/ej2-react-charts';
import * as React from 'react';
import * as ReactDOM from "react-dom";

function App() {
    return (
        <RangeNavigatorComponent id='charts'>
            <Inject services={[AreaSeries, DateTime, RangeTooltip]} />
        </RangeNavigatorComponent>
    );
}

export default App;
const root = ReactDOM.createRoot(document.getElementById('charts'));
root.render(<App />);
Populate Range Navigator with data
Add a series object to the Range Navigator by using the series property. Map the JSON fields x and y to the series xName and yName properties, and set the JSON array as the dataSource property.
Since the JSON contains category data, set the valueType for the horizontal axis (primaryXAxis) to Category. By default, the axis valueType is Numeric.
import { AreaSeries, DateTime, Inject, RangeNavigatorComponent, RangenavigatorSeriesCollectionDirective, RangenavigatorSeriesDirective, RangeTooltip } from '@syncfusion/ej2-react-charts';
import * as React from "react";
import * as ReactDOM from "react-dom";
import { bitCoinData } from '../default-data';

function App() {
  const data = bitCoinData;

  return <RangeNavigatorComponent id='charts' valueType='DateTime' labelFormat='MMM-yy' value={[new Date('2017-09-01'), new Date('2018-02-01')]}>
    <Inject services={[AreaSeries, DateTime, RangeTooltip]} />
    <RangenavigatorSeriesCollectionDirective>
      <RangenavigatorSeriesDirective dataSource={data} xName='x' yName='y' type='Area' width={2} />
    </RangenavigatorSeriesCollectionDirective>
  </RangeNavigatorComponent>;
}

export default App;

const root = ReactDOM.createRoot(document.getElementById('charts'));
root.render(<App />);
import {
AreaSeries, DateTime, Inject, RangeNavigatorComponent, RangenavigatorSeriesCollectionDirective,
RangenavigatorSeriesDirective, RangeTooltip
} from '@syncfusion/ej2-react-charts';
import * as React from "react";
import * as ReactDOM from "react-dom";
import { bitCoinData } from '../default-data';
function App() {
const data: object[] = bitCoinData;
return <RangeNavigatorComponent id='charts'
valueType='DateTime' labelFormat='MMM-yy' value={[new Date('2017-09-01'), new Date('2018-02-01')]}>
<Inject services={[AreaSeries, DateTime, RangeTooltip]} />
<RangenavigatorSeriesCollectionDirective>
<RangenavigatorSeriesDirective dataSource={data} xName='x' yName='y' type='Area' width={2} />
</RangenavigatorSeriesCollectionDirective>
</RangeNavigatorComponent>
}
export default App;
const root = ReactDOM.createRoot(document.getElementById('charts'));
root.render(<App />);Enable tooltip
The tooltip is useful to show the selected data. You can enable tooltip by setting the enable property as true in tooltip object and by injecting RangeTooltip module into the services.
import { AreaSeries, DateTime, Inject, RangeNavigatorComponent, RangenavigatorSeriesCollectionDirective, RangenavigatorSeriesDirective, RangeTooltip } from '@syncfusion/ej2-react-charts';
import * as React from "react";
import * as ReactDOM from "react-dom";
import { bitCoinData } from '../default-data';

function App() {
  const data = bitCoinData;
  const tooltip = { enable: true, displayMode: 'Always' };
  return <RangeNavigatorComponent id='charts' valueType='DateTime' labelFormat='MMM-yy' value={[new Date('2017-09-01'), new Date('2018-02-01')]} tooltip={tooltip}>
    <Inject services={[AreaSeries, DateTime, RangeTooltip]} />
    <RangenavigatorSeriesCollectionDirective>
      <RangenavigatorSeriesDirective dataSource={data} xName='x' yName='y' type='Area' width={2} />
    </RangenavigatorSeriesCollectionDirective>
  </RangeNavigatorComponent>;
}

export default App;

const root = ReactDOM.createRoot(document.getElementById('charts'));
root.render(<App />);
import {
AreaSeries, DateTime, Inject, RangeNavigatorComponent, RangenavigatorSeriesCollectionDirective,
RangenavigatorSeriesDirective, RangeTooltip, RangeTooltipSettingsModel
} from '@syncfusion/ej2-react-charts';
import * as React from "react";
import * as ReactDOM from "react-dom";
import { bitCoinData } from '../default-data';
function App() {
const data: object[] = bitCoinData;
const tooltip: RangeTooltipSettingsModel = { enable: true, displayMode: 'Always' };
return <RangeNavigatorComponent id='charts'
valueType='DateTime' labelFormat='MMM-yy' value={[new Date('2017-09-01'), new Date('2018-02-01')]}
tooltip={tooltip}>
<Inject services={[AreaSeries, DateTime, RangeTooltip]} />
<RangenavigatorSeriesCollectionDirective>
<RangenavigatorSeriesDirective dataSource={data} xName='x' yName='y' type='Area' width={2} />
</RangenavigatorSeriesCollectionDirective>
</RangeNavigatorComponent>
}
export default App;
const root = ReactDOM.createRoot(document.getElementById('charts'));
root.render(<App />);