Getting Started with Syncfusion® JavaScript (ES5) Accumulation Chart Control
12 Aug 20266 minutes to read
Build your first Syncfusion JavaScript (ES5) application with a simple Accumulation Chart control in just a few minutes. This quickstart guides you through creating a minimal, runnable HTML page that loads the Syncfusion EJ2 (ES5) Accumulation Chart from the CDN, initializes it with sample data, and renders an interactive chart.
The
33.2.3version segment in the CDN URLs is shown for reference. Replace it with the latest published version from the Syncfusion EJ2 CDN when you start a new project.
Prerequisites
- Visual Studio Code (or any text editor)
- A modern web browser (Chrome, Edge, Firefox, or Safari)
- An active internet connection to fetch the CDN scripts
Quick Setup
Step 1: Create a folder and an HTML file
- Create a folder named
quickstartin your desired directory. - Inside the
quickstartfolder, create a new file namedindex.html.
Step 2: Add Syncfusion® CDN resources
The chart needs the EJ2 script bundles. Add the following to the <head> of index.html:
Scripts (JavaScript):
https://cdn.syncfusion.com/ej2/33.2.3/ej2-base/dist/global/ej2-base.min.js
https://cdn.syncfusion.com/ej2/33.2.3/ej2-data/dist/global/ej2-data.min.js
https://cdn.syncfusion.com/ej2/33.2.3/ej2-pdf-export/dist/global/ej2-pdf-export.min.js
https://cdn.syncfusion.com/ej2/33.2.3/ej2-svg-base/dist/global/ej2-svg-base.min.js
https://cdn.syncfusion.com/ej2/33.2.3/ej2-charts/dist/global/ej2-charts.min.js
Load the scripts in the order shown: ej2-base → ej2-data → ej2-svg-base → ej2-charts. ej2-pdf-export is only required if you use the PDF export feature; it is omitted from the example below.
Step 3: Add the Accumulation Chart control to the application
Replace the contents of index.html with the following complete code. This loads the required EJ2 scripts, defines the chart container, and renders the chart.
<!DOCTYPE html>
<html lang="en">
  <head>
    <meta charset="utf-8" />
    <meta name="viewport" content="width=device-width, initial-scale=1.0" />
    <title>Syncfusion Accumulation Chart - Quick Start</title>

    <!-- Scripts -->
    <script src="https://cdn.syncfusion.com/ej2/33.2.3/ej2-base/dist/global/ej2-base.min.js"></script>
    <script src="https://cdn.syncfusion.com/ej2/33.2.3/ej2-data/dist/global/ej2-data.min.js"></script>
    <script src="https://cdn.syncfusion.com/ej2/33.2.3/ej2-svg-base/dist/global/ej2-svg-base.min.js"></script>
    <script src="https://cdn.syncfusion.com/ej2/33.2.3/ej2-charts/dist/global/ej2-charts.min.js"></script>
  </head>

  <body>
    <h1>Syncfusion Accumulation Chart</h1>

    <!-- Container which renders the Accumulation chart -->
    <div id="element"></div>

    <script>
      // Sample data
      var chartData = [
        { month: 'Jan', sales: 35 },
        { month: 'Feb', sales: 28 },
        { month: 'Mar', sales: 34 },
        { month: 'Apr', sales: 32 },
        { month: 'May', sales: 40 },
        { month: 'Jun', sales: 32 },
        { month: 'Jul', sales: 35 },
        { month: 'Aug', sales: 55 },
        { month: 'Sep', sales: 38 },
        { month: 'Oct', sales: 30 },
        { month: 'Nov', sales: 25 },
        { month: 'Dec', sales: 32 }
      ];

      // Initialize the Accumulation Chart
      var chart = new ej.charts.AccumulationChart({
        series: [
          {
            dataSource: chartData,
            xName: 'month',
            yName: 'sales',
            type: 'Pie'
          }
        ],
        title: 'Sales Data'
      });

      // Render the chart to the target container
      chart.appendTo('#element');
    </script>
  </body>
</html>
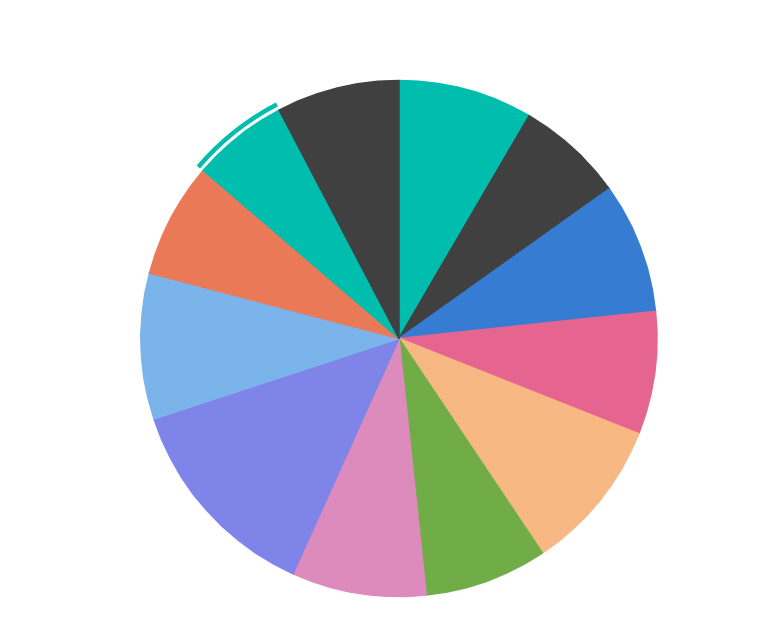
The series properties dataSource, xName, and yName bind the JSON fields to the chart. By default, a Pie series is rendered when only the data source is provided.
Step 4: Open in browser
Open the quickstart/index.html file in your web browser. You can either double-click the file or right-click in VS Code and choose Open with Live Server (requires the Live Server extension). The chart renders the sample data on the page.
Output
The following screenshot shows the output of the Syncfusion Accumulation Chart quick start application:
Troubleshooting
-
Chart does not render — Verify that the scripts load in the order
ej2-base→ej2-data→ej2-svg-base→ej2-charts. Open the browser’s developer console and check for404orReferenceErrormessages. -
ej is not defined— One of the CDN script tags failed to load. Check your network connection and verify the CDN URLs are correct. -
CORS or
file://errors — Some browsers block ES5 module loading fromfile://. Serve the file from a local HTTP server (for example, the VS Code Live Server extension). -
Wrong chart type — Confirm the
typeproperty in the series matches the expected chart (for example,Pie,Doughnut,Funnel,Pyramid).
See also
- Pie Chart
- Doughnut Chart
- Funnel Chart
- Pyramid Chart
- Accumulation Chart Legend
- Accumulation Chart Data Labels
- Accumulation Chart Tooltip
- API Reference: AccumulationChart
- API Reference: AccumulationSeries
Ready to streamline your Syncfusion® JavaScript development? Discover the full potential of Syncfusion® JavaScript controls with Syncfusion® AI Coding Assistant. Explore Syncfusion® AI Coding Assistant