Getting started with EJ2 TypeScript Sankey control
31 Jul 20266 minutes to read
This document explains how to create a simple Sankey diagram and configure its features in TypeScript using the Essential JS 2 webpack quickstart seed repository.
This application is integrated with the
webpack.config.jsconfiguration and uses the latest version of the webpack-cli. Ensure that Node.js is installed on your machine. For more information about webpack and its features, refer to the webpack getting-started guide.
Prerequisites
Before you begin, ensure you have the following installed on your machine:
- Node.js
- Visual Studio Code (or any text editor)
- Git for cloning the quickstart repository
- A modern web browser (Chrome, Edge, Firefox, or Safari) to view the result
Dependencies
The Sankey control is included in the @syncfusion/ej2-charts package. Below is the list of core and optional dependencies used by the package.
|-- @syncfusion/ej2-charts
    |-- @syncfusion/ej2-base
    |-- @syncfusion/ej2-data
    |-- @syncfusion/ej2-pdf-export
    |-- @syncfusion/ej2-file-utils
    |-- @syncfusion/ej2-compression
    |-- @syncfusion/ej2-svg-base
Note: @syncfusion/ej2-pdf-export, @syncfusion/ej2-file-utils, and @syncfusion/ej2-compression are optional—required only for PDF export features.
Quick Setup
Step 1: Open Command Prompt
Open the command prompt and navigate to the directory where you want to create the project.
-
For Windows: Open Command Prompt (cmd) or PowerShell and use the
cdcommand to navigate to your desired directory. -
For macOS/Linux: Open Terminal and use the
cdcommand to navigate to your desired directory.
Step 2: Clone the Quickstart Repository
Run the following command to clone the Syncfusion JavaScript (Essential JS 2) quickstart project from GitHub.
git clone https://github.com/SyncfusionExamples/ej2-quickstart-webpack ej2-quickstartStep 3: Navigate to Project Folder
After cloning the application in the ej2-quickstart folder, run the following command to navigate to the project directory.
cd ej2-quickstartStep 4: Install Required Packages
Syncfusion JavaScript (Essential JS 2) packages are available on the npmjs.com public registry. You can install all Syncfusion JavaScript (Essential JS 2) controls in a single @syncfusion/ej2 package or individual packages for each control.
The quickstart application is already preconfigured with the dependent @syncfusion/ej2 package in the ~/package.json file. Use the following command to install all the dependent npm packages from the command prompt:
npm installStep 5: Update the HTML Template
Open the ej2-quickstart folder in Visual Studio Code or any text editor of your choice.
Locate the ~/src/index.html file in the project, preserve any existing <link> and <script> tags that were generated by the seed, and add the HTML div tag with its id attribute as element inside <body> to initialize the Sankey container.
<!DOCTYPE html>
<html lang="en">

<head>
    <title>Essential JS 2 Sankey</title>
    <meta charset="utf-8" />
    <meta name="viewport" content="width=device-width, initial-scale=1.0" />
    <meta name="description" content="TypeScript UI Controls" />
    <meta name="author" content="Syncfusion" />
    <!-- existing head content from the seed template remains here -->
</head>

<body>
    <h1>Syncfusion Sankey</h1>
    <!--container which is going to render the Sankey-->
    <div id='element'>
    </div>
</body>

</html>
Step 6: Create the Sankey Component with Data
Locate the src/app/app.ts file in your project and add the Sankey component with module injection and sample data.
Module Injection: The Sankey component requires specific feature modules to be injected. For displaying tooltips, legend, and the export option, inject the SankeyTooltip, SankeyLegend, and SankeyExport modules.
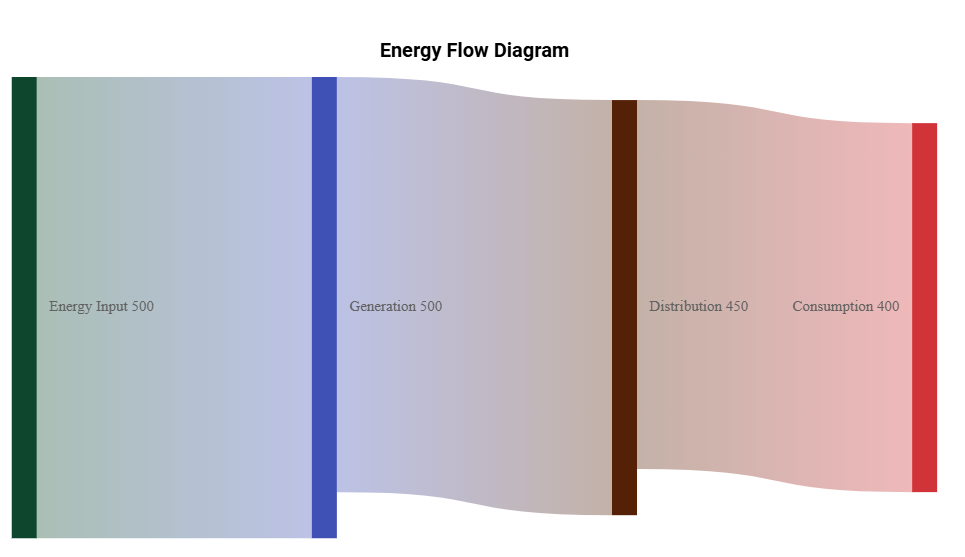
Populate Sankey with Data: Create a nodes array (each node has a unique id and an optional label) and a links array (each link references a sourceId and targetId plus a numeric value that controls the link thickness). Pass both arrays to the Sankey component’s nodes and links properties.
import { Sankey, SankeyNodeModel, SankeyLinkModel } from '@syncfusion/ej2-charts';

const nodes: SankeyNodeModel[] = [
  { id: 'Energy Input', label: { text: 'Energy Input' } },
  { id: 'Generation', label: { text: 'Generation' } },
  { id: 'Distribution', label: { text: 'Distribution' } },
  { id: 'Consumption', label: { text: 'Consumption' } }
];

const links: SankeyLinkModel[] = [
  { sourceId: 'Energy Input', targetId: 'Generation', value: 500 },
  { sourceId: 'Generation', targetId: 'Distribution', value: 450 },
  { sourceId: 'Distribution', targetId: 'Consumption', value: 400 }
];

const sankey: Sankey = new Sankey(
  {
     width:  '90%',
    height: '420px',
    title: 'Energy Flow Diagram',
    nodes: nodes,
    links: links
  },
  '#element'
);
Step 7: Run the Application
Open the integrated terminal in Visual Studio Code or use your command prompt to run the application. Use the npm run start command:
npm run startThe application will compile and automatically start in your default web browser. The application typically runs at http://localhost:4000. You should see the Syncfusion® Sankey control displayed on the page. To stop the dev server, press Ctrl+C in the terminal.
Output
The following screenshot shows the output of the Syncfusion Sankey quick start application.
Troubleshooting
-
Blank page, no Sankey — The npm package failed to load. Verify the network tab and that
npm installfinished successfully. -
Cannot find module '@syncfusion/ej2-charts'— Dependencies were not installed. Re-runnpm install. -
Sankey is undefined—Sankey.Inject(...)was not called before thenew Sankey(...)call. Add theInjectline at the top ofapp.ts. -
Diagram renders without data — Mismatched
sourceId/targetIdandnode.idvalues. Ensure every link references an existing node id; unmatched ids are silently dropped. -
TypeScript compile errors after
npm install— Runnpm run buildto view the complete error details. Common causes include missing dependencies, incorrect import statements, or mismatched Syncfusion package versions.