Getting Started with EJ2 TypeScript Accumulation Chart
12 Aug 20267 minutes to read
This document explains how to create a simple Accumulation Chart and configure its features in TypeScript using the Essential JS 2 webpack quickstart seed repository.
This application is integrated with the
webpack.config.jsconfiguration and uses the latest version of the webpack-cli. Ensure that Node.js is installed on your machine. For more information about webpack and its features, refer to the webpack getting-started guide.
Prerequisites
Before you begin, ensure you have the following installed on your machine:
- Node.js
- Visual Studio Code (or any text editor)
- Git (for cloning the quickstart repository)
- A web browser to view the result
Dependencies
Below is the list of dependencies used by the @syncfusion/ej2-charts package.
|-- @syncfusion/ej2-charts
    |-- @syncfusion/ej2-base
    |-- @syncfusion/ej2-data
    |-- @syncfusion/ej2-pdf-export
    |-- @syncfusion/ej2-file-utils
    |-- @syncfusion/ej2-compression
    |-- @syncfusion/ej2-svg-base
Note:
@syncfusion/ej2-pdf-export,@syncfusion/ej2-file-utils, and@syncfusion/ej2-compressionare optional and required only for PDF export features. Omit them if you are not using exports.
Quick Setup
Step 1: Open Command Prompt
Open the command prompt and navigate to the directory where you want to create the project.
-
For Windows: Open Command Prompt (cmd) or PowerShell and use the
cdcommand to navigate to your desired directory. -
For macOS/Linux: Open Terminal and use the
cdcommand to navigate to your desired directory.
Step 2: Clone the Quickstart Repository
Run the following command to clone the Syncfusion JavaScript (Essential JS 2) quickstart project from GitHub.
git clone https://github.com/SyncfusionExamples/ej2-quickstart-webpack ej2-quickstartThis creates an ej2-quickstart folder in the current directory that contains the seed project.
Step 3: Navigate to Project Folder
Run the following command to navigate to the cloned project directory.
cd ej2-quickstartStep 4: Install Required Packages
Syncfusion JavaScript (Essential JS 2) packages are available on the npmjs.com public registry. Install either the umbrella package or the individual control package:
- Umbrella:
@syncfusion/ej2— all Syncfusion controls in a single package. - Individual:
@syncfusion/ej2-charts— the Accumulation Chart and its required dependencies.
The quickstart application is preconfigured with the @syncfusion/ej2 dependency in the ~/package.json file. Use the following command to install all the npm packages from the command prompt.
npm installThis command downloads and installs all the dependencies required for the project.
Step 5: Update the HTML Template
Open the ej2-quickstart folder in Visual Studio Code or any text editor of your choice.
Note: Code snippets here use webpack for local development. For online demos or StackBlitz, SystemJS may be used—ignore loader/helper scripts in rendered previews.
Locate the ~/src/index.html file in the project and add an HTML <div> element with its id attribute set to element to host the chart.
<!DOCTYPE html>
<html lang="en">

<head>
    <title>Essential JS 2 Accumulation Chart</title>
    <meta charset="utf-8" />
    <meta name="viewport" content="width=device-width, initial-scale=1.0" />
    <meta name="description" content="TypeScript UI Controls" />
    <meta name="author" content="Syncfusion" />
</head>

<body>
     <h1>Syncfusion Accumulation Chart</h1>
     <!-- Container which renders the Accumulation chart -->
     <div id='element'></div>
</body>

</html>
Step 6: Create the Accumulation Chart Component with Data
Locate the src/app/app.ts file in your project. Import the AccumulationChart component, prepare the sample data, and instantiate the chart.
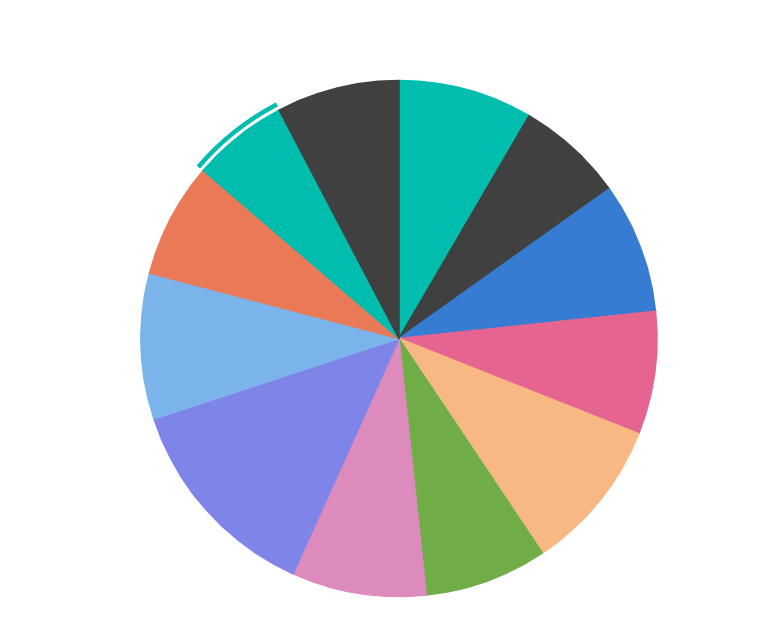
By default, a Pie series is rendered when JSON data is assigned to the series dataSource property. Map JSON fields to the series xName and yName properties to bind data correctly.
import { AccumulationChart } from '@syncfusion/ej2-charts';

// Sample data for the Accumulation Chart
let pieData: Object[] = [
    { month: 'Jan', sales: 35 },
    { month: 'Feb', sales: 28 },
    { month: 'Mar', sales: 34 },
    { month: 'Apr', sales: 32 },
    { month: 'May', sales: 40 },
    { month: 'Jun', sales: 32 },
    { month: 'Jul', sales: 35 },
    { month: 'Aug', sales: 55 },
    { month: 'Sep', sales: 38 },
    { month: 'Oct', sales: 30 },
    { month: 'Nov', sales: 25 },
    { month: 'Dec', sales: 32 }
];

// Initialize the Accumulation Chart
let chart: AccumulationChart = new AccumulationChart({
    series: [
        {
            dataSource: pieData,
            xName: 'month',
            yName: 'sales',
            type: 'Pie'
        }
    ]
});

// Render the chart to the target container
chart.appendTo('#element');
Step 7: Run the Application
Open the integrated terminal in Visual Studio Code, or use your command prompt, and run the application with the npm run start command.
npm run startThe application compiles and automatically opens in your default web browser. By default, the dev server runs at http://localhost:4000. If that port is in use, webpack selects the next available port and prints the URL in the terminal.
When the build completes, the Syncfusion® Accumulation Chart control renders on the page and is ready for further customization.
Output
The following screenshot shows the output of the Syncfusion Accumulation Chart quick start application:
Troubleshooting
-
Cannot find module '@syncfusion/ej2-charts'— Dependencies are not installed. Runnpm installin the project root. -
Port
4000already in use — Another process is bound to the port. Stop the conflicting process or changedevServer.portinwebpack.config.js. -
TypeScript build error — TypeScript version mismatch. Install TypeScript as a dev dependency:
npm install typescript --save-dev. -
Chart does not render — Verify that the
idof the target element iselement, theapp.tsfile is saved, andnpm run startcompleted without errors.