Labels
17 Feb 202219 minutes to read
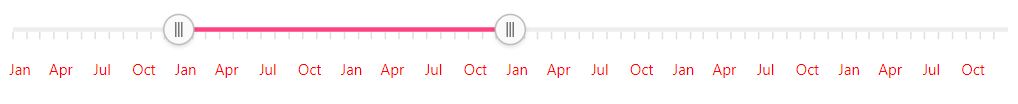
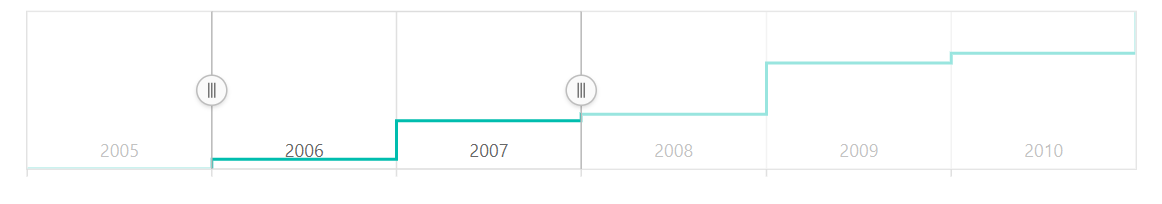
Multilevel labels
The multi-level labels for the Range Selector can be enabled by setting the enableGrouping property to true. This is restricted to the DateTime axis alone.
@(Html.EJS().RangeNavigator("container")
                    .ValueType(Syncfusion.EJ2.Charts.RangeValueType.DateTime)
                    .LabelFormat("MMM-yy")
                    .EnableGrouping(true)
                .Series(sr =>
                {
                    sr.XName("x").YName("y").DataSource(ViewBag.dataSource).Add();
                }).Render()
                )
public IActionResult Index()
{
List<data> dataSource = new List<data>
{
new data { x = new DateTime(2005, 01, 01), y = 21, y1 = 28 },
new data { x = new DateTime(2006, 01, 01), y = 24, y1 = 44 },
new data { x = new DateTime(2007, 01, 01), y = 36, y1 = 48 },
new data { x = new DateTime(2008, 01, 01), y = 38, y1 = 50 },
new data { x = new DateTime(2009, 01, 01), y = 54, y1 = 66 },
new data { x = new DateTime(2010, 01, 01), y = 57, y1 = 78 },
new data { x = new DateTime(2011, 01, 01), y = 70, y1 = 84 },
};
ViewBag.dataSource = dataSource;
return View();
}
public class data
{
public DateTime x;
public double y;
public double y1;
}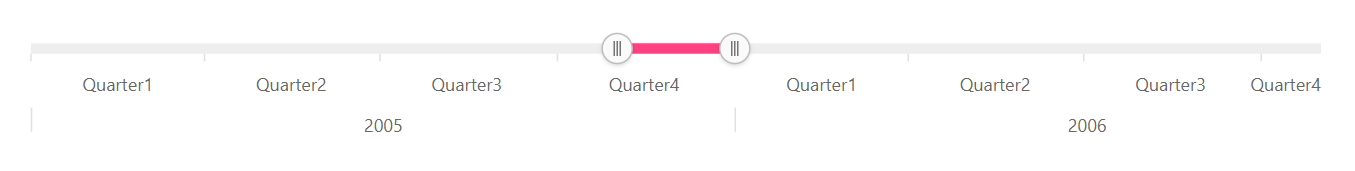
Grouping
The multi-level labels can be grouped using the groupBy property with the following interval types:
- Auto
- Years
- Quarter
- Months
- Weeks
- Days
- Hours
- Minutes
- Seconds
@(Html.EJS().RangeNavigator("container")
                    .ValueType(Syncfusion.EJ2.Charts.RangeValueType.DateTime)
                    .LabelFormat("MMM-yy").RangeIntervalType.Months")
                    .EnableGrouping(True)
                .Series(sr =>
                {
                    sr.XName("x").YName("y").DataSource(ViewBag.dataSource).Add();
                }).Render()
                )
public IActionResult Index()
{
List<data> dataSource = new List<data>
{
new data { x = new DateTime(2005, 01, 01), y = 21, y1 = 28 },
new data { x = new DateTime(2006, 01, 01), y = 24, y1 = 44 },
new data { x = new DateTime(2007, 01, 01), y = 36, y1 = 48 },
new data { x = new DateTime(2008, 01, 01), y = 38, y1 = 50 },
new data { x = new DateTime(2009, 01, 01), y = 54, y1 = 66 },
new data { x = new DateTime(2010, 01, 01), y = 57, y1 = 78 },
new data { x = new DateTime(2011, 01, 01), y = 70, y1 = 84 },
};
ViewBag.dataSource = dataSource;
return View();
}
public class data
{
public DateTime x;
public double y;
public double y1;
}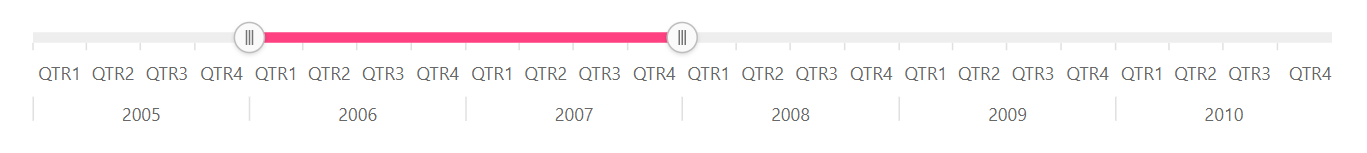
Smart labels
The labelIntersectAction property is used to avoid overlapping of labels. The following code sample shows the setting of labelIntersectAction property to Hide.
@(Html.EJS().RangeNavigator("container")
                    .ValueType(Syncfusion.EJ2.Charts.RangeValueType.DateTime)
                    .LabelFormat("MMM-yy")
                    .EdgeLabelPlacement(Syncfusion.EJ2.Chart.EdgeLabelPlacement.Shift)
                    .LabelIntersectAction(Syncfusion.EJ2.Chart.LabelIntersectAction.Hide)
                .Series(sr =>
                {
                    sr.XName("x").YName("y").DataSource(ViewBag.dataSource).Add();
                }).Render()
                )
public IActionResult Index()
{
List<data> dataSource = new List<data>
{
new data { x = new DateTime(2005, 01, 01), y = 21, y1 = 28 },
new data { x = new DateTime(2006, 01, 01), y = 24, y1 = 44 },
new data { x = new DateTime(2007, 01, 01), y = 36, y1 = 48 },
new data { x = new DateTime(2008, 01, 01), y = 38, y1 = 50 },
new data { x = new DateTime(2009, 01, 01), y = 54, y1 = 66 },
new data { x = new DateTime(2010, 01, 01), y = 57, y1 = 78 },
new data { x = new DateTime(2011, 01, 01), y = 70, y1 = 84 },
};
ViewBag.dataSource = dataSource;
return View();
}
public class data
{
public DateTime x;
public double y;
public double y1;
}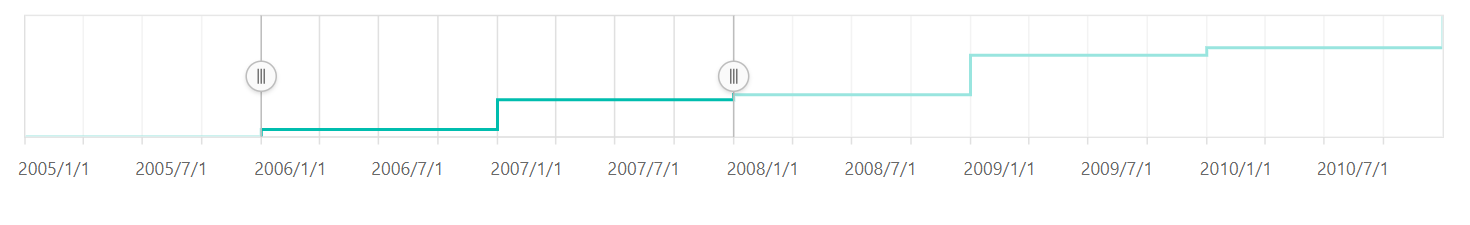
Label positioning
By default, the labels can be placed outside the Range Selector. It can also be placed inside the Range Selector using the labelPosition property.
@(Html.EJS().RangeNavigator("container")
                    .ValueType(Syncfusion.EJ2.Charts.RangeValueType.DateTime)
                    .LabelFormat("MMM-yy")
                .Series(sr =>
                {
                    sr.XName("x").YName("y").DataSource(ViewBag.dataSource).Add();
                }).Render()
                )
public IActionResult Index()
{
List<data> dataSource = new List<data>
{
new data { x = new DateTime(2005, 01, 01), y = 21, y1 = 28 },
new data { x = new DateTime(2006, 01, 01), y = 24, y1 = 44 },
new data { x = new DateTime(2007, 01, 01), y = 36, y1 = 48 },
new data { x = new DateTime(2008, 01, 01), y = 38, y1 = 50 },
new data { x = new DateTime(2009, 01, 01), y = 54, y1 = 66 },
new data { x = new DateTime(2010, 01, 01), y = 57, y1 = 78 },
new data { x = new DateTime(2011, 01, 01), y = 70, y1 = 84 },
};
ViewBag.dataSource = dataSource;
return View();
}
public class data
{
public DateTime x;
public double y;
public double y1;
}
Labels customization
The font size, color, family, etc. can be customized using the labelStyle setting.
@(Html.EJS().RangeNavigator("container")
                    .ValueType(Syncfusion.EJ2.Charts.RangeValueType.DateTime)
                    .LabelFormat("MMM-yy")
                .Series(sr =>
                {
                    sr.XName("x").YName("y").DataSource(ViewBag.dataSource).Add();
                }).Render()
                )
public IActionResult Index()
{
List<data> dataSource = new List<data>
{
new data { x = new DateTime(2005, 01, 01), y = 21, y1 = 28 },
new data { x = new DateTime(2006, 01, 01), y = 24, y1 = 44 },
new data { x = new DateTime(2007, 01, 01), y = 36, y1 = 48 },
new data { x = new DateTime(2008, 01, 01), y = 38, y1 = 50 },
new data { x = new DateTime(2009, 01, 01), y = 54, y1 = 66 },
new data { x = new DateTime(2010, 01, 01), y = 57, y1 = 78 },
new data { x = new DateTime(2011, 01, 01), y = 70, y1 = 84 },
};
ViewBag.dataSource = dataSource;
return View();
}
public class data
{
public DateTime x;
public double y;
public double y1;
}