How can I help you?
Grouping in ASP.NET MVC Pivot Table Component
21 Dec 202213 minutes to read
NOTE
This feature is applicable only for relational data source.
Grouping is the most-useful feature in pivot table and the component automatically groups date, time, number and string. For example, the date type can be formatted and displayed based on year, quarter, month, and more. Likewise, the number type can be grouped range-wise, such as 1-5, 6-10, etc. These group fields will act as individual fields and allows users to drag them between different axes such as columns, rows, values, and filters and create pivot table at runtime.
The grouping can be enabled by setting the AllowGrouping property in PivotView class to true.
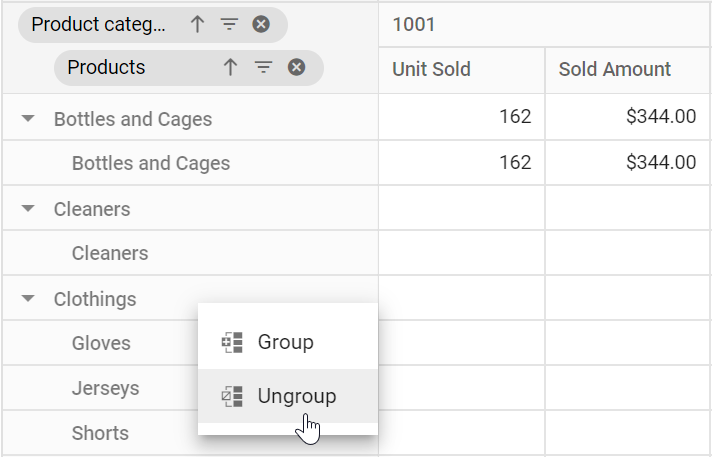
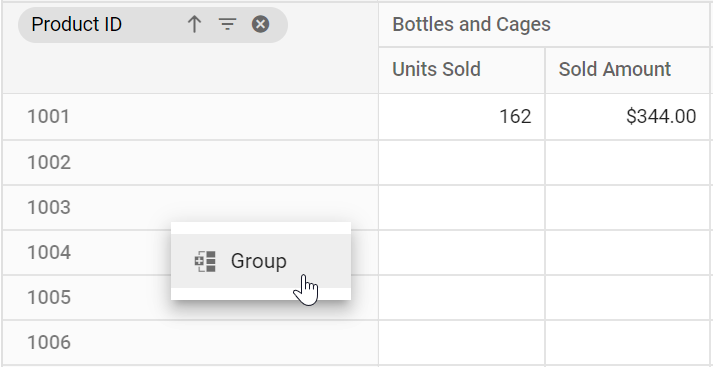
To perform the grouping action via UI, right click on the pivot table’s row or column header, select “Group”, a dialog will appear in which fill the appropriate options to group the data. To ungroup,right click on the pivot table’s row or column header, select “Ungroup”.
The following are the three different types of grouping:
- Number Grouping
- Date Grouping
- Custom Grouping
NOTE
Similar to Excel, only one type of grouping can be applied for a field.
@Html.EJS().PivotView("PivotView").Width("100%").Height("350").ShowGroupingBar(true).AllowGrouping(true).DataSourceSettings(dataSource => dataSource.DataSource((IEnumerable<object>)ViewBag.DataSource).ExpandAll(false).EnableSorting(true)
    .FormatSettings(formatsettings => { formatsettings.Name("Amount").Format("C").Add();
        formatsettings.Name("Product_ID").Format("N0").Add();
        formatsettings.Name("Date").Type("date").Format("dd/MM/yyyy-hh:mm a").Add();
    })
    .Rows(rows => { rows.Name("Date").Add(); })
    .Columns(columns => { columns.Name("Product_ID").Caption("Product ID").Add(); })
    .Values(values =>
    {
        values.Name("Sold").Caption("Units Sold").Add();
        values.Name("Amount").Caption("Sold Amount").Add(); })).Render()
public ActionResult Index()
{
var data = GetGroupData();
ViewBag.DataSource = data;
return View();
}Number Grouping
Number grouping allows users to organize data, which is in number format into different ranges, such as 1-5, 6-10, etc. Number grouping can be configured via UI, by right-clicking on the number based header in the pivot table.
@Html.EJS().PivotView("PivotView").Width("100%").Height("350").ShowGroupingBar(true).AllowGrouping(true).DataSourceSettings(dataSource => dataSource.DataSource((IEnumerable<object>)ViewBag.DataSource).ExpandAll(false).EnableSorting(true)
    .FormatSettings(formatsettings => { formatsettings.Name("Amount").Format("C").Add();
        formatsettings.Name("Product_ID").Format("N0").Add();
    })
    .Rows(rows => { rows.Name("Product_ID").Caption("Product ID").Add(); })
    .Columns(columns => { columns.Name("Products").Add(); })
    .Values(values =>
    {
        values.Name("Sold").Caption("Units Sold").Add();
        values.Name("Amount").Caption("Sold Amount").Add(); })).Render()
public ActionResult Index()
{
var data = GetGroupData();
ViewBag.DataSource = data;
return View();
}
Range selection
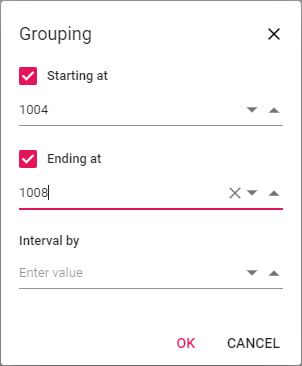
The “Starting at” and “Ending at” options are used to set the number range depending on which the headers will be grouped. For example, if the “Product_ID” field holds the number from “1001” to “1010” and the user chooses to group the number range by setting “1004” to “Starting at” and “1008” to “Ending at” options on their own. Then the specified number range will be used for number grouping and the rest will be grouped as “Out of Range”.
Range interval
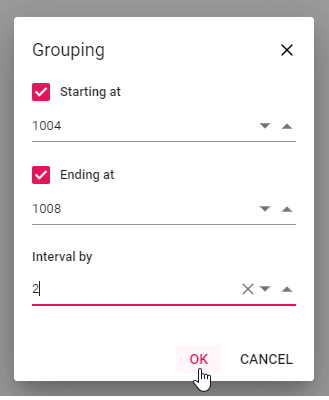
The “Interval by” option is used to separate the selected number data type field into range-wise such as 1-5, 6-10, etc.
For example, if the user wants to display the “Product_ID” data field with a group interval of “2” by setting the “Interval by” option on their own. The “Product_ID” field will then be grouped by the specified range of intervals, such as “1004-1005”, “1006-1007“,etc.
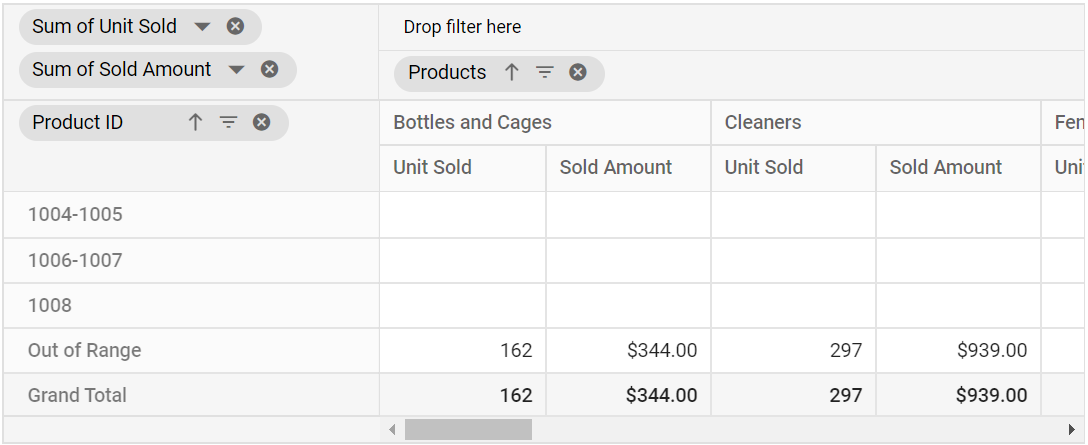
Number grouping can also be configured using the PivotViewGroupSettings class through code-behind. The properties required are:
-
Name: Allows user to set the field name. -
RangeInterval: Allows user to set the interval between two numbers. -
StartingAt: Allows user to set the starting number. -
EndingAt: Allows user to set the ending number. -
Type: Allows user to set the group type. For number grouping, Number is set.
NOTE
If starting and ending numbers specified in
StartingAtandEndingAtproperties are in-between the number range, then rest of the numbers will be grouped and placed in “Out of Range” section introduced specific to this feature.
@Html.EJS().PivotView("PivotView").Width("100%").Height("350").ShowGroupingBar(true).AllowGrouping(true).DataSourceSettings(dataSource => dataSource.DataSource((IEnumerable<object>)ViewBag.DataSource).ExpandAll(false).EnableSorting(true)
    .FormatSettings(formatsettings => { formatsettings.Name("Amount").Format("C").Add();
        formatsettings.Name("Product_ID").Format("N0").Add();
    })
    .Rows(rows => { rows.Name("Product_ID").Caption("Product ID").Add(); })
    .Columns(columns => { columns.Name("Products").Add(); })
    .Values(values =>
    {
        values.Name("Sold").Caption("Units Sold").Add();
        values.Name("Amount").Caption("Sold Amount").Add(); })
    .GroupSettings(groupsettings => { groupsettings.Name("Product_ID").Type("Number").RangeInterval(2).StartingAt(1004).EndingAt(1008).Add();
    })).Render()
public ActionResult Index()
{
var data = GetGroupData();
ViewBag.DataSource = data;
return View();
}
Ungrouping the existing number groups
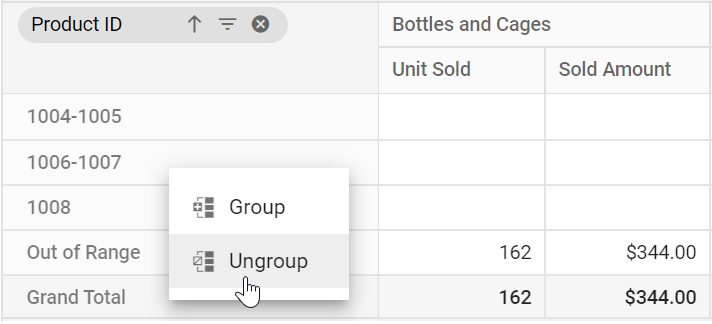
By right-clicking the appropriate header and selecting “Ungroup” from the context menu in the pivot table component, users can ungroup the applied number grouping.
Date Grouping
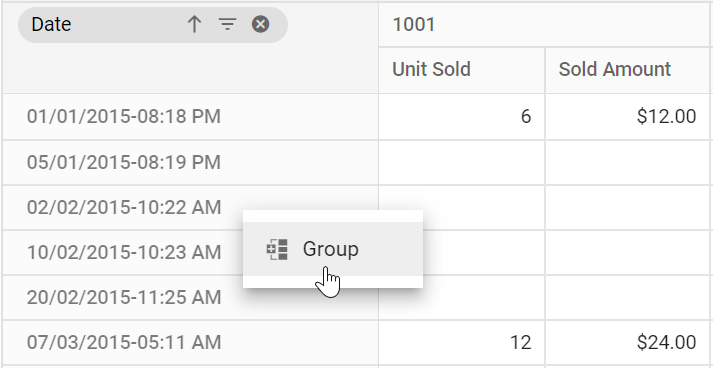
Date grouping allows users to organize data, which is in date format into different sections such as years, quarters, months, days, hours, minutes, and seconds. Date grouping can be configured via UI, by right-clicking on the date and time based header in the pivot table.
@Html.EJS().PivotView("PivotView").Width("100%").Height("350").ShowGroupingBar(true).AllowGrouping(true).DataSourceSettings(dataSource => dataSource.DataSource((IEnumerable<object>)ViewBag.DataSource).ExpandAll(false).EnableSorting(true)
    .FormatSettings(formatsettings => { formatsettings.Name("Amount").Format("C").Add();
        formatsettings.Name("Date").Type("date").Format("dd/MM/yyyy-hh:mm a").Add();
    })
    .Rows(rows => { rows.Name("Date").Add(); })
    .Columns(columns => { columns.Name("Product_Categories").Caption("Product Categories").Add(); })
    .Values(values =>
    {
        values.Name("Sold").Caption("Units Sold").Add();
        values.Name("Amount").Caption("Sold Amount").Add(); })).Render()
public ActionResult Index()
{
var data = GetGroupData();
ViewBag.DataSource = data;
return View();
}
Range selection
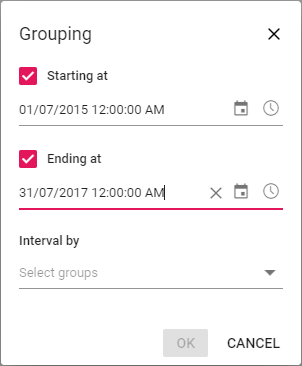
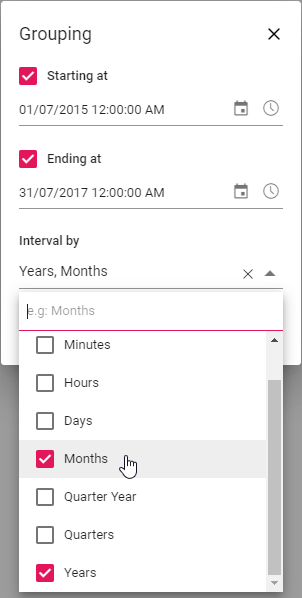
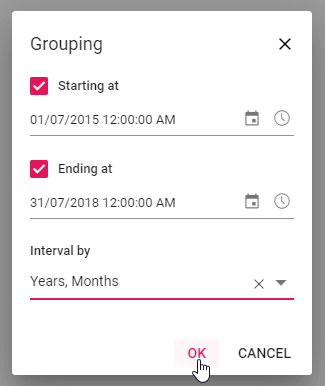
The “Starting at” and “Ending at” options are used to set the date range depending on which the headers will be grouped. For example, if the “Date” field holds the date from “01/01/2015” to “02/12/2018” and the user chooses to group the date range by setting “01/07/2015” to “Starting at” and “31/07/2017” to “Ending at” options on their own. Then the specified date range will be used for date grouping and the rest will be considered as “Out of Range”.
Group interval
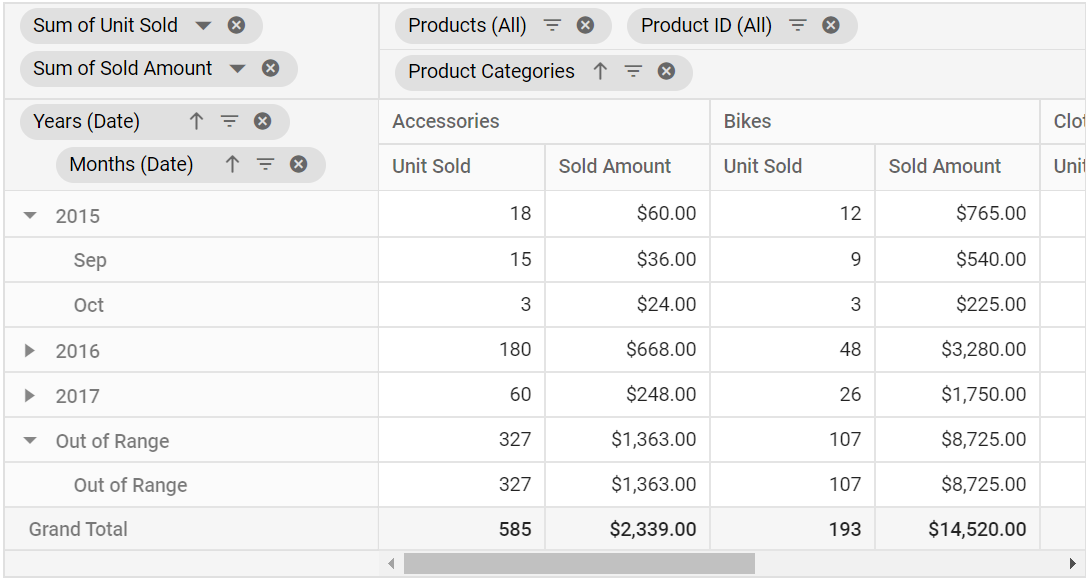
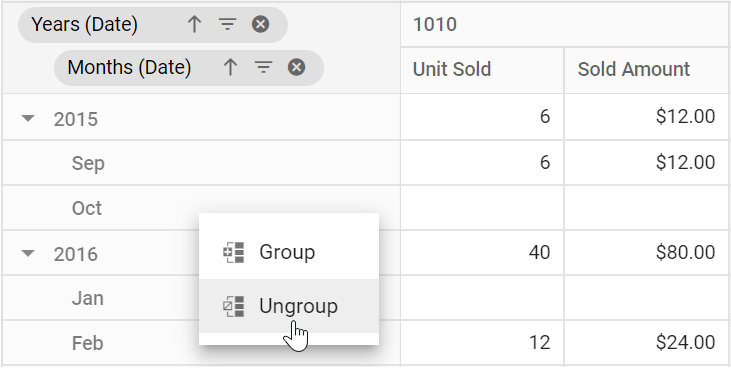
The “Interval by” option is used to separate the selected date fields into years, quarters, months, days, hours, minutes and seconds. For example, if the user wants to display the “Date” field with group intervals as “Years” and “Months” by selecting the “Interval by” option on their own. The “Date” field will then be separated by the specified group intervals and created as two new fields, namely “Years (Date)” which holds the date years and “Months (Date)” which holds the date months. Such fields can be used for report manipulations in the pivot table at runtime.
NOTE
When none of the Interval by options are chosen, the OK button in the dialog will be disabled, meaning that at least one interval option should be selected in order to apply the date grouping.
Date grouping can also be configured using the PivotViewGroupSettings class through code-behind. The properties required are:
-
Name: Allows user to set the field name. -
Type: Allows user to set the group type. For date grouping, Date is set. -
StartingAt: Allows user to set starting date. -
EndingAt: Allows user to set ending date. -
GroupInterval: Allows user to set interval in year, quarter, month, day, hour, minute, or second pattern.
NOTE
From the date format “YYYY-DD-MM HH:MM:SS”, if user wants to display only year and month, then the
GroupIntervalproperty should be set with Years and Months alone. Also, user can shuffle the order of year, quarter, month, day, hour, minute, or second based on their requirement and display the same in the pivot table.
@Html.EJS().PivotView("PivotView").Width("100%").Height("350").ShowGroupingBar(true).AllowGrouping(true).DataSourceSettings(dataSource => dataSource.DataSource((IEnumerable<object>)ViewBag.DataSource).ExpandAll(false).EnableSorting(true)
    .FormatSettings(formatsettings => { formatsettings.Name("Amount").Format("C").Add();
        formatsettings.Name("Date").Type("date").Format("dd/MM/yyyy-hh:mm a").Add();
    })
    .Rows(rows => { rows.Name("Date").Add(); })
    .Columns(columns => { columns.Name("Product_Categories").Caption("Product Categories").Add(); })
    .Values(values =>
    {
        values.Name("Sold").Caption("Units Sold").Add();
        values.Name("Amount").Caption("Sold Amount").Add(); })
    .Filters(filters =>
    {
        filters.Name("Products").Add();
        filters.Name("Product_ID").Caption("Product ID").Add(); })
    .GroupSettings(groupsettings => { groupsettings.Name("Date").Type("Date").GroupInterval("@(new List<string>() { "Years", "Months" })").StartingAt("2015-07-01").EndingAt("2017-07-31").Add();
    })).Render()
public ActionResult Index()
{
var data = GetGroupData();
ViewBag.DataSource = data;
return View();
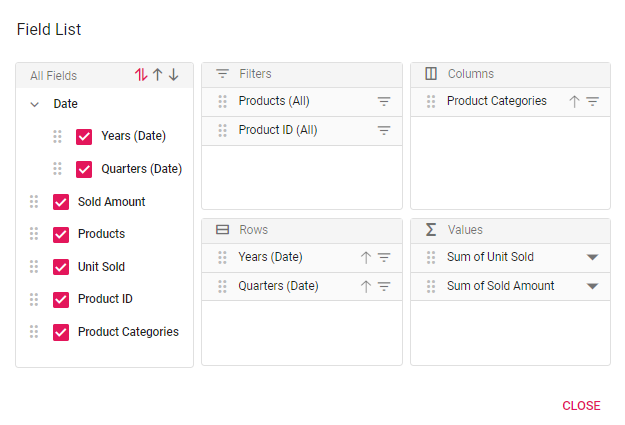
}Furthermore, in the field list UI, these date group fields Years (Date), Quarters (Date), Months (Date), etc… will be automatically grouped and displayed under the Date folder name.
Ungrouping the existing date groups
By right-clicking the appropriate header and selecting “Ungroup” from the context menu in the pivot table component, users can ungroup the applied date grouping.
Custom Grouping
Custom grouping can group any data type, such as date, time, number and string, into a custom field based on the user’s needs. It can be configured via the UI by right-clicking on any header in the pivot table.
@Html.EJS().PivotView("PivotView").Width("100%").Height("350").ShowGroupingBar(true).AllowGrouping(true).DataSourceSettings(dataSource => dataSource.DataSource((IEnumerable<object>)ViewBag.DataSource).ExpandAll(false).EnableSorting(true)
    .FormatSettings(formatsettings => { formatsettings.Name("Amount").Format("C").Add();
        formatsettings.Name("Product_ID").Format("N0").Add();
    })
    .Rows(rows => { rows.Name("Products").Add(); })
    .Columns(columns => { columns.Name("Product_ID").Caption("Product ID").Add(); })
    .Values(values =>
    {
        values.Name("Sold").Caption("Units Sold").Add();
        values.Name("Amount").Caption("Sold Amount").Add(); })).Render()
public ActionResult Index()
{
var data = GetGroupData();
ViewBag.DataSource = data;
return View();
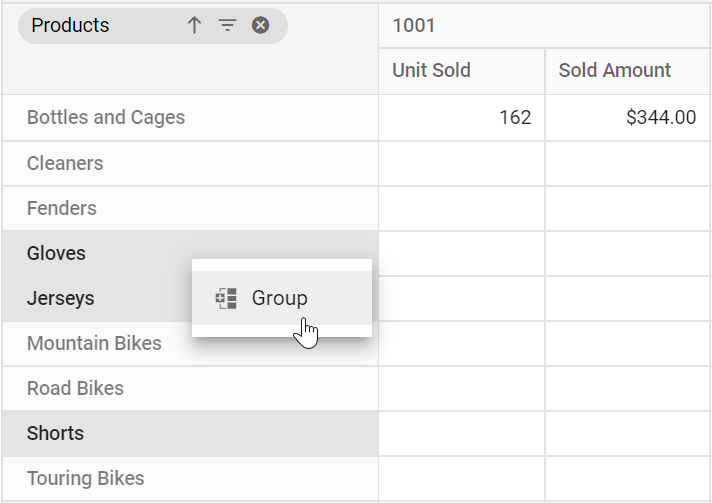
}In order to create custom grouping in the pivot table, a minimum of two headers belonging to a specific field should be chosen. To select more than one header, press and hold the CTRL key or hold the SHIFT key and click the appropriate row or column headers. Once selection is done, right-click and select “Group”.
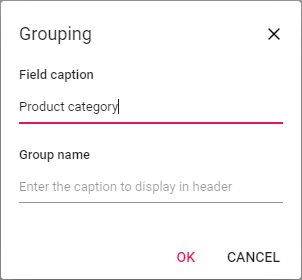
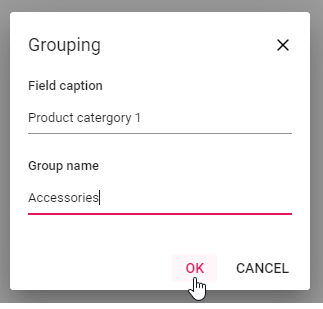
In the dialog, the “Field caption” is the alias name of the new custom field that will be used to shown up in the pivot table component.
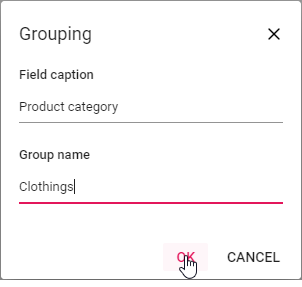
The “Group Name” option helps to set the name of the header to hold the other selected headers. For example, if the user wants to group headers such as “Gloves”, “Jerseys” and “Shorts” in the “Products” field by setting the top level name as “Clothings” to “Group Name” on their own. The selected headers are then grouped under the name “Clothings” in the pivot table.
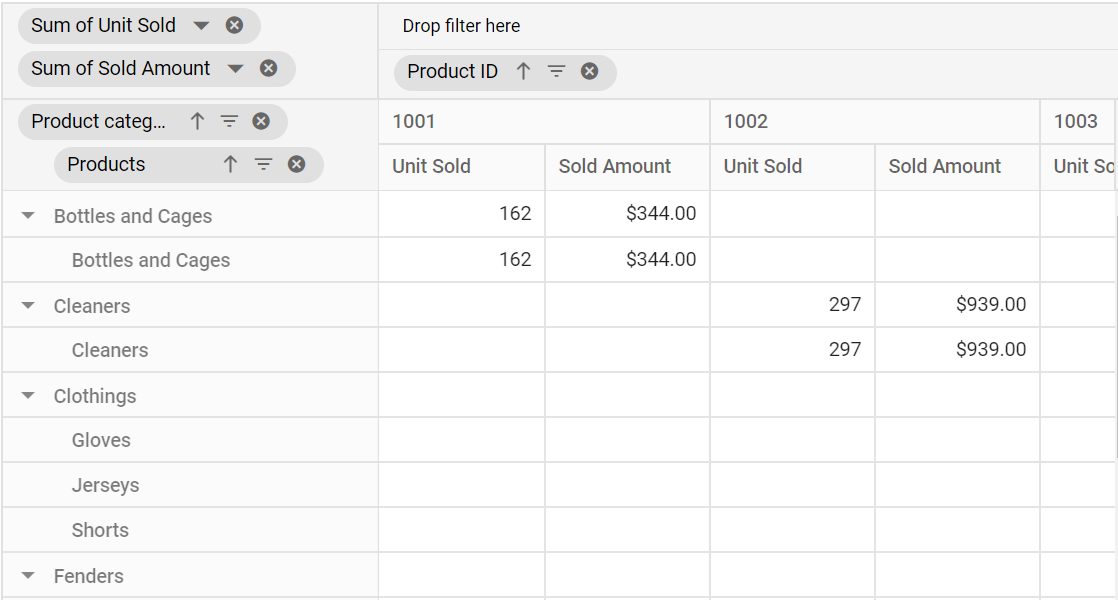
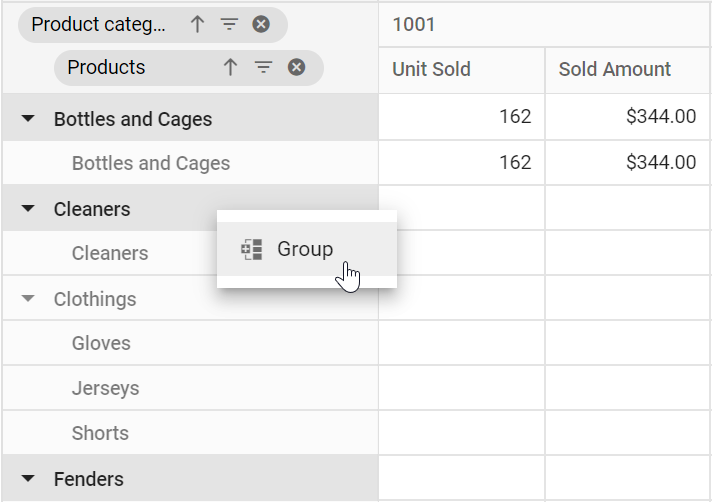
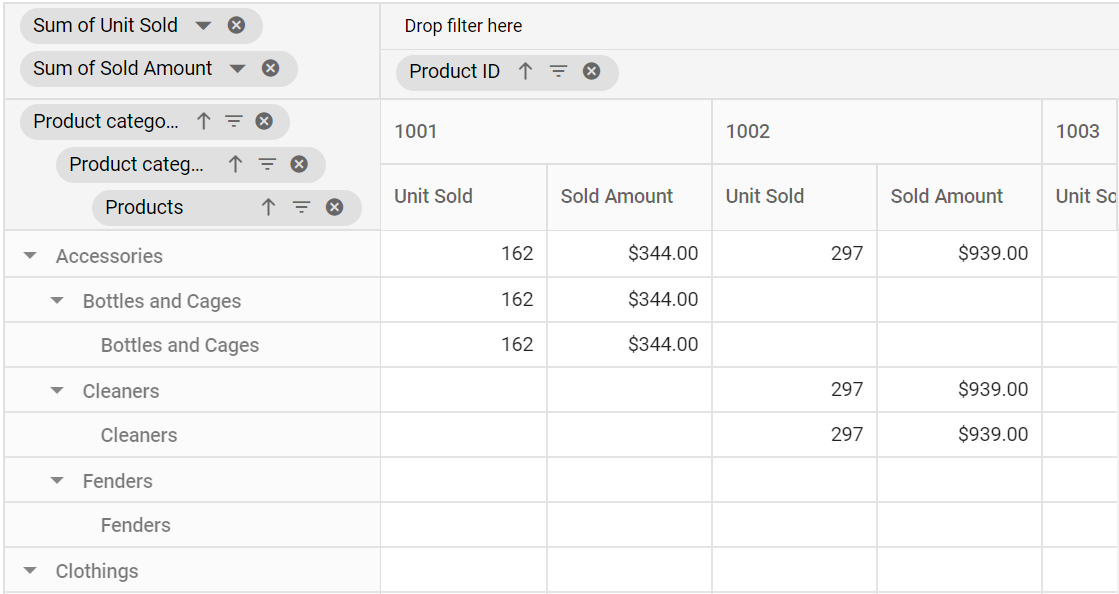
User can also apply new custom grouping options to an existing custom field by right-clicking on the custom group header in the pivot table. For example, if the user wants to create a new custom group for the current custom group headers such as “Bottles and Cages”, ”Cleaners” and “Fenders” by setting the top level name as “Accessories” to “Group Name” on their own. The selected headers will then be grouped in the pivot table under the name “Accessories” with a new custom field called “Product category 1”.
Custom grouping can also be configured using the PivotViewGroupSettings class through code-behind. The properties required are:
-
Name: Allows user to set the field name. -
Caption: Allows user to set the caption name for custom grouping field. -
CustomGroups: Allows user to set the custom groups. -
Type: Allows user to set the group type. For custom grouping, Custom is set.
The available custom group properties in CustomGroups property are:
-
GroupName: Allows user to set the group name (or title) for selected headers. -
Items: It allows to set the headers which needs to be grouped from display.
NOTE
When the
GroupNamewith the headers listed inItemsin theCustomGroupsclass is grouped by the definedGroupNameand the rest is grouped by its own name in the pivot table.
@Html.EJS().PivotView("PivotView").Width("100%").Height("350").ShowGroupingBar(true).AllowGrouping(true).DataSourceSettings(dataSource => dataSource.DataSource((IEnumerable<object>)ViewBag.DataSource).ExpandAll(false).EnableSorting(true)
    .FormatSettings(formatsettings => { formatsettings.Name("Amount").Format("C").Add();
        formatsettings.Name("Product_ID").Format("N0").Add();
    })
    .Rows(rows => { rows.Name("Products").Add(); })
    .Columns(columns => { columns.Name("Product_ID").Caption("Product ID").Add(); })
    .Values(values =>
    {
        values.Name("Sold").Caption("Units Sold").Add();
        values.Name("Amount").Caption("Sold Amount").Add(); })
    .GroupSettings(groupsettings => { groupsettings.Name("Products").Type("Custom").Caption("Product catergory").CustomGroups(customgroup => { customgroup.GroupName("Clothings").Items("@(new string[] { "Gloves", "Jerseys", "Shorts" })").Add(); }).Add();
    })).Render()
public ActionResult Index()
{
var data = GetGroupData();
ViewBag.DataSource = data;
return View();
}
Ungrouping the existing custom groups
By right-clicking the appropriate header and selecting “Ungroup” from the context menu in the pivot table component, users can ungroup the applied custom grouping.
NOTE
When a specific field is removed from the report after ungrouping, its custom group fields will also be removed from the pivot table.
