Drill through in ASP.NET MVC Pivot Table component
24 Apr 20267 minutes to read
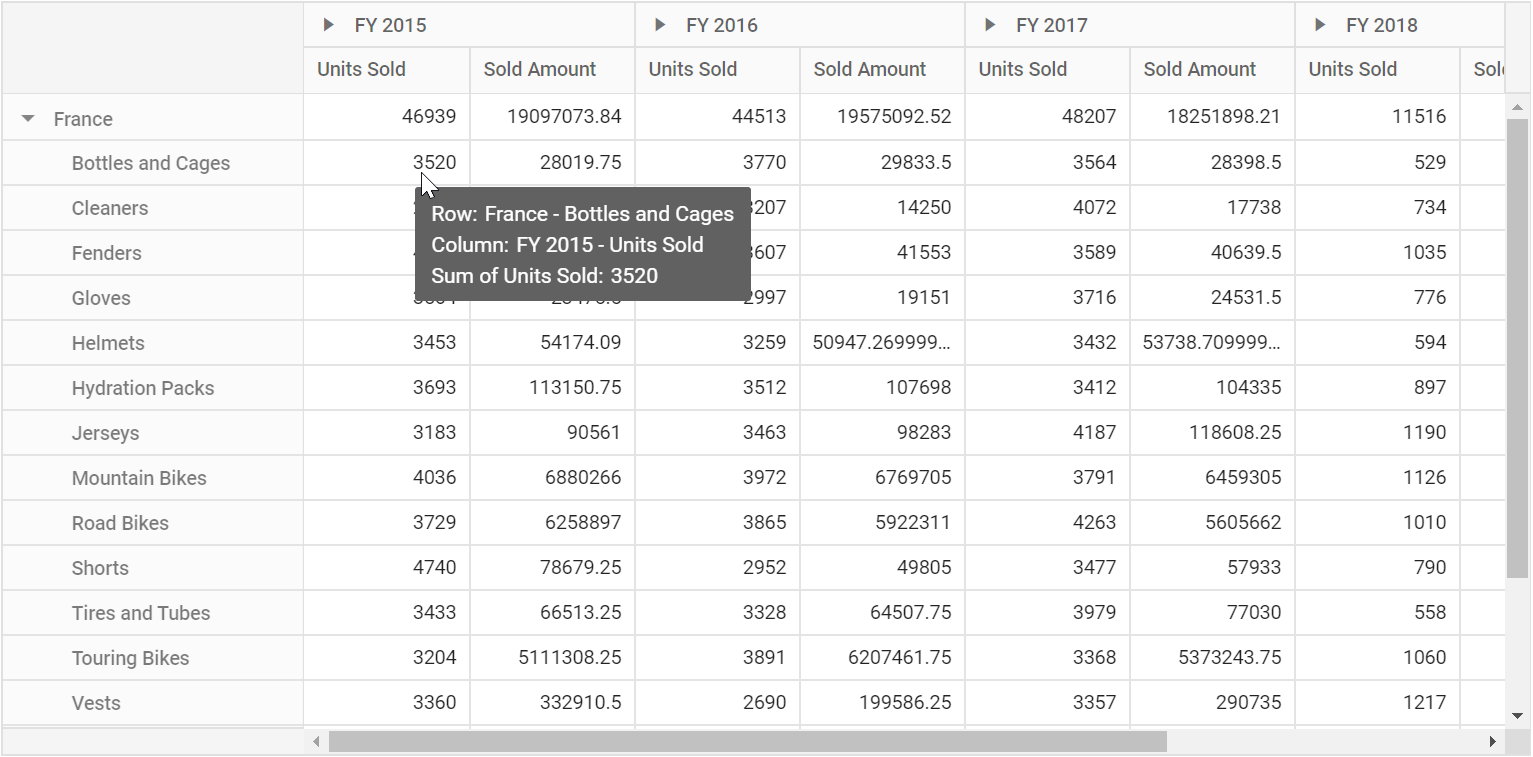
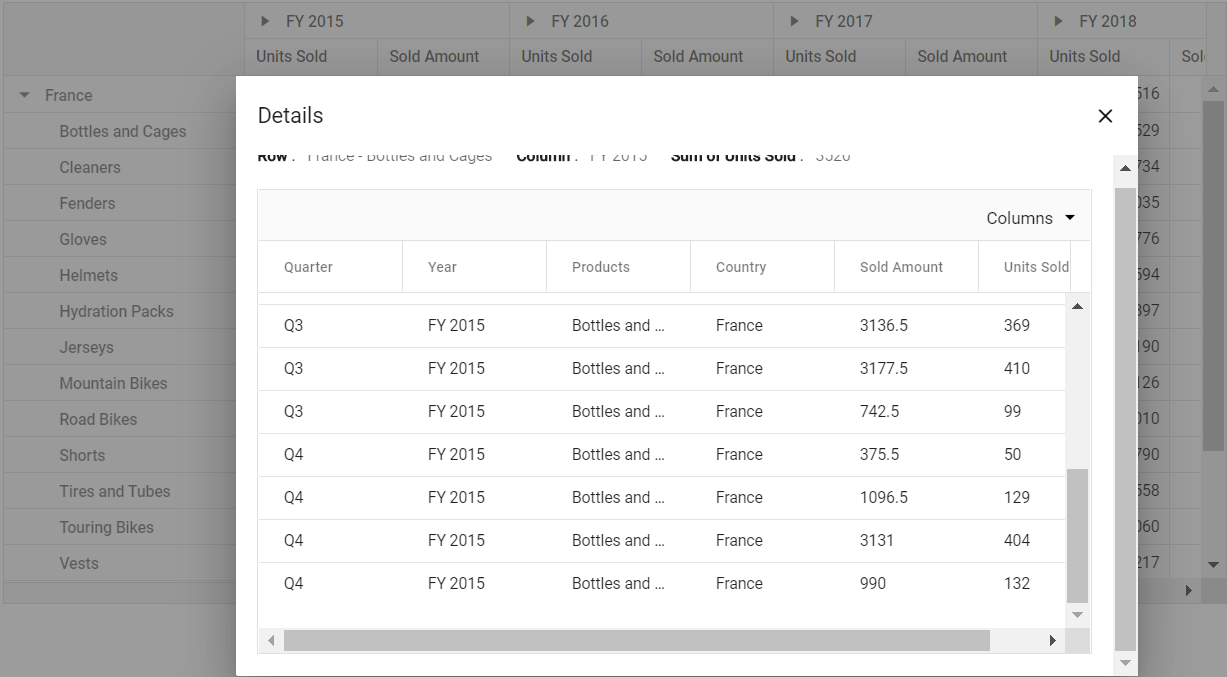
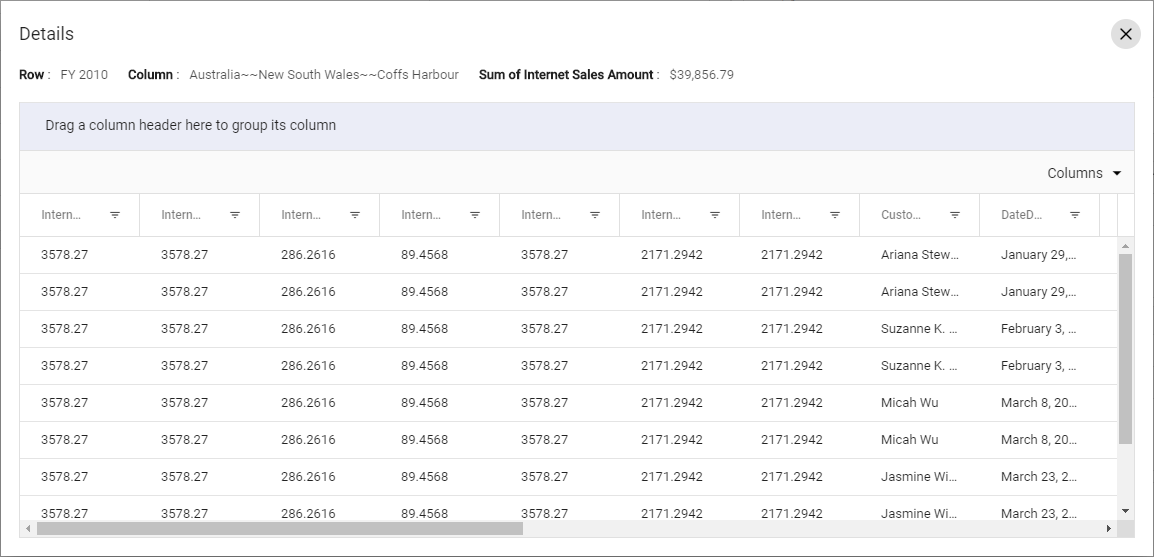
The drill-through feature in the Pivot Table component allows users to view the raw, unaggregated data behind any aggregated cell in the Pivot Table. To enable this feature, set the AllowDrillThrough property to true. By double-clicking an aggregated cell, users can view its detailed raw data in a data grid displayed in a new window. The new window shows the row header, column header, and measure name of the selected cell at the top. Additionally, users can include or exclude fields available in the data grid using the column chooser option.
To use the drill-through feature, inject the DrillThrough module in the Pivot Table.
Below is an example of enabling drill-through in a Pivot Table:
@Html.EJS().PivotView("PivotView").Width("100%").Height("300").ShowTooltip(false).DataSourceSettings(dataSource => dataSource.DataSource((IEnumerable<object>)ViewBag.DataSource).ExpandAll(false).EnableSorting(true)
 .FormatSettings(formatsettings =>
 {
     formatsettings.Name("Amount").Format("C0").MaximumSignificantDigits(10).MinimumSignificantDigits(1).UseGrouping(true).Add();
 }).Rows(rows =>
 {
     rows.Name("Country").Add(); rows.Name("Products").Add();
 }).Columns(columns =>
 {
     columns.Name("Year").Caption("Year").Add(); columns.Name("Quarter").Add();
 }).Values(values =>
 {
     values.Name("Sold").Caption("Units Sold").Add(); values.Name("Amount").Caption("Sold Amount").Add();
 })).AllowDrillThrough(true).Render()
public ActionResult Index()
{
var data = GetPivotData();
ViewBag.DataSource = data;
return View();
}
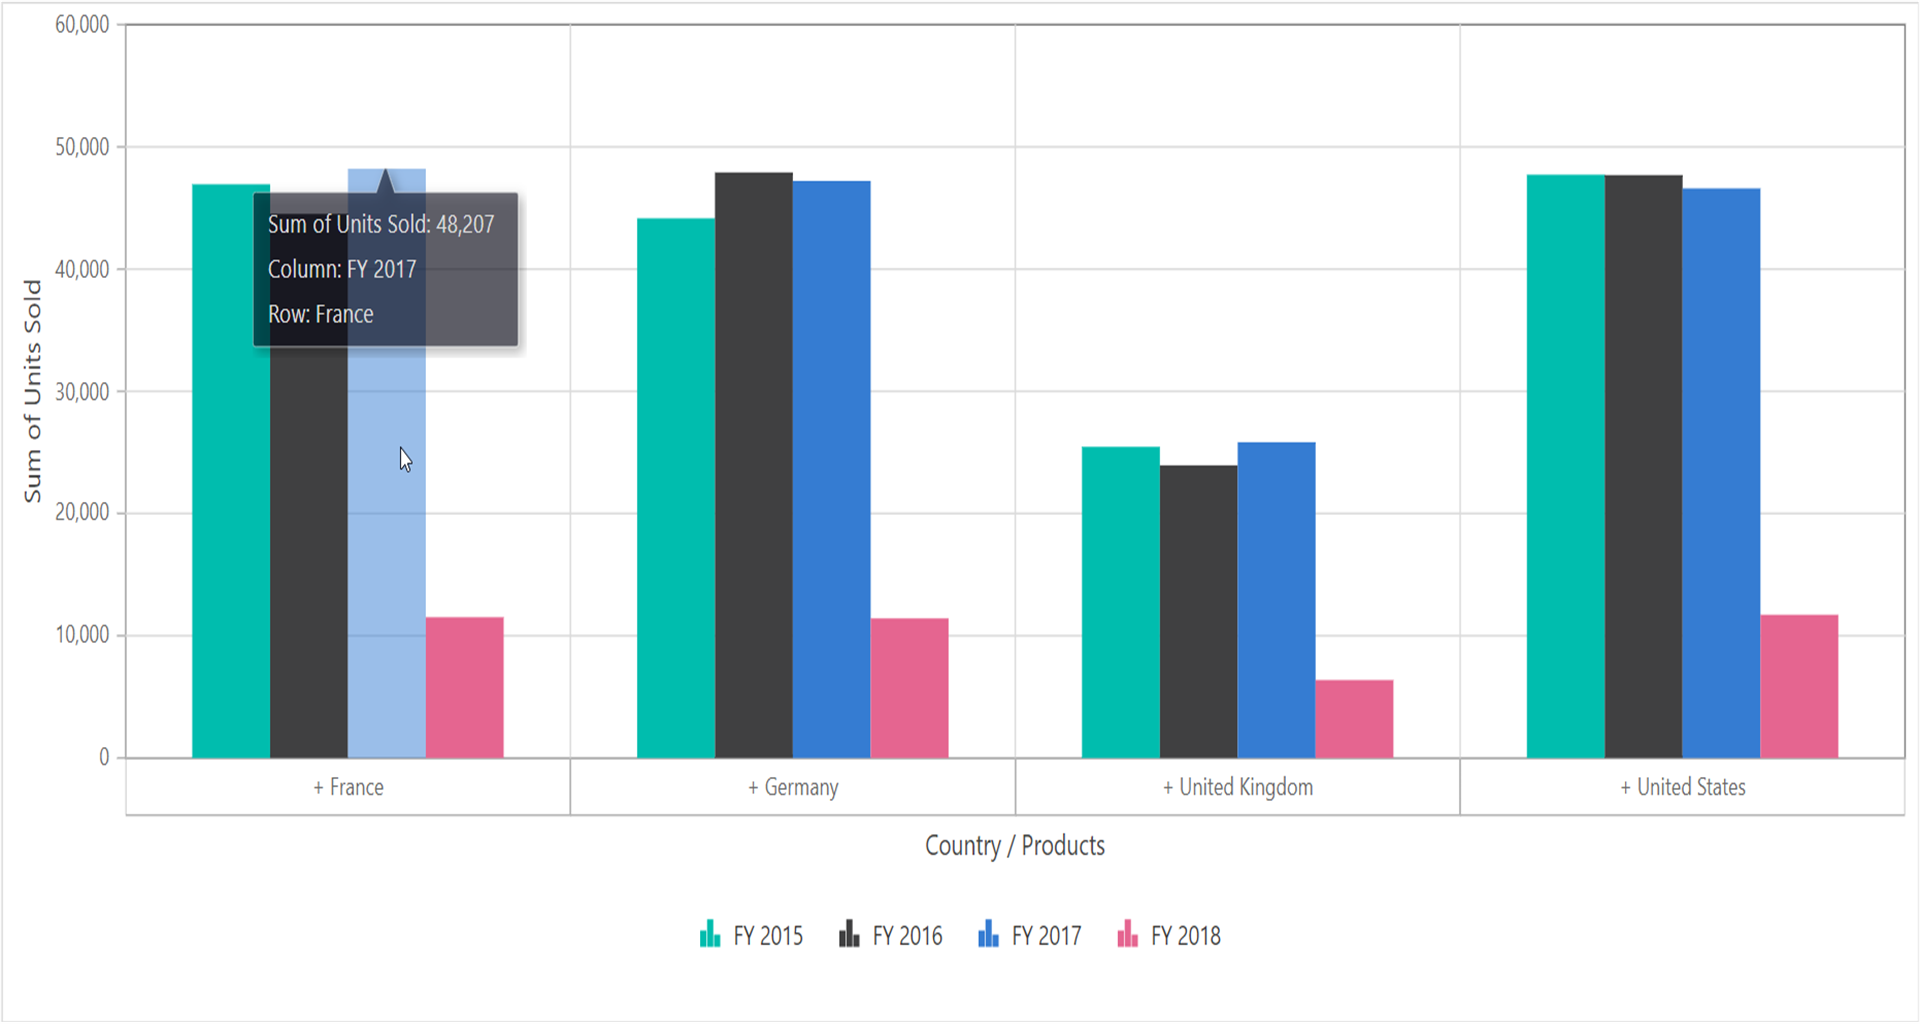
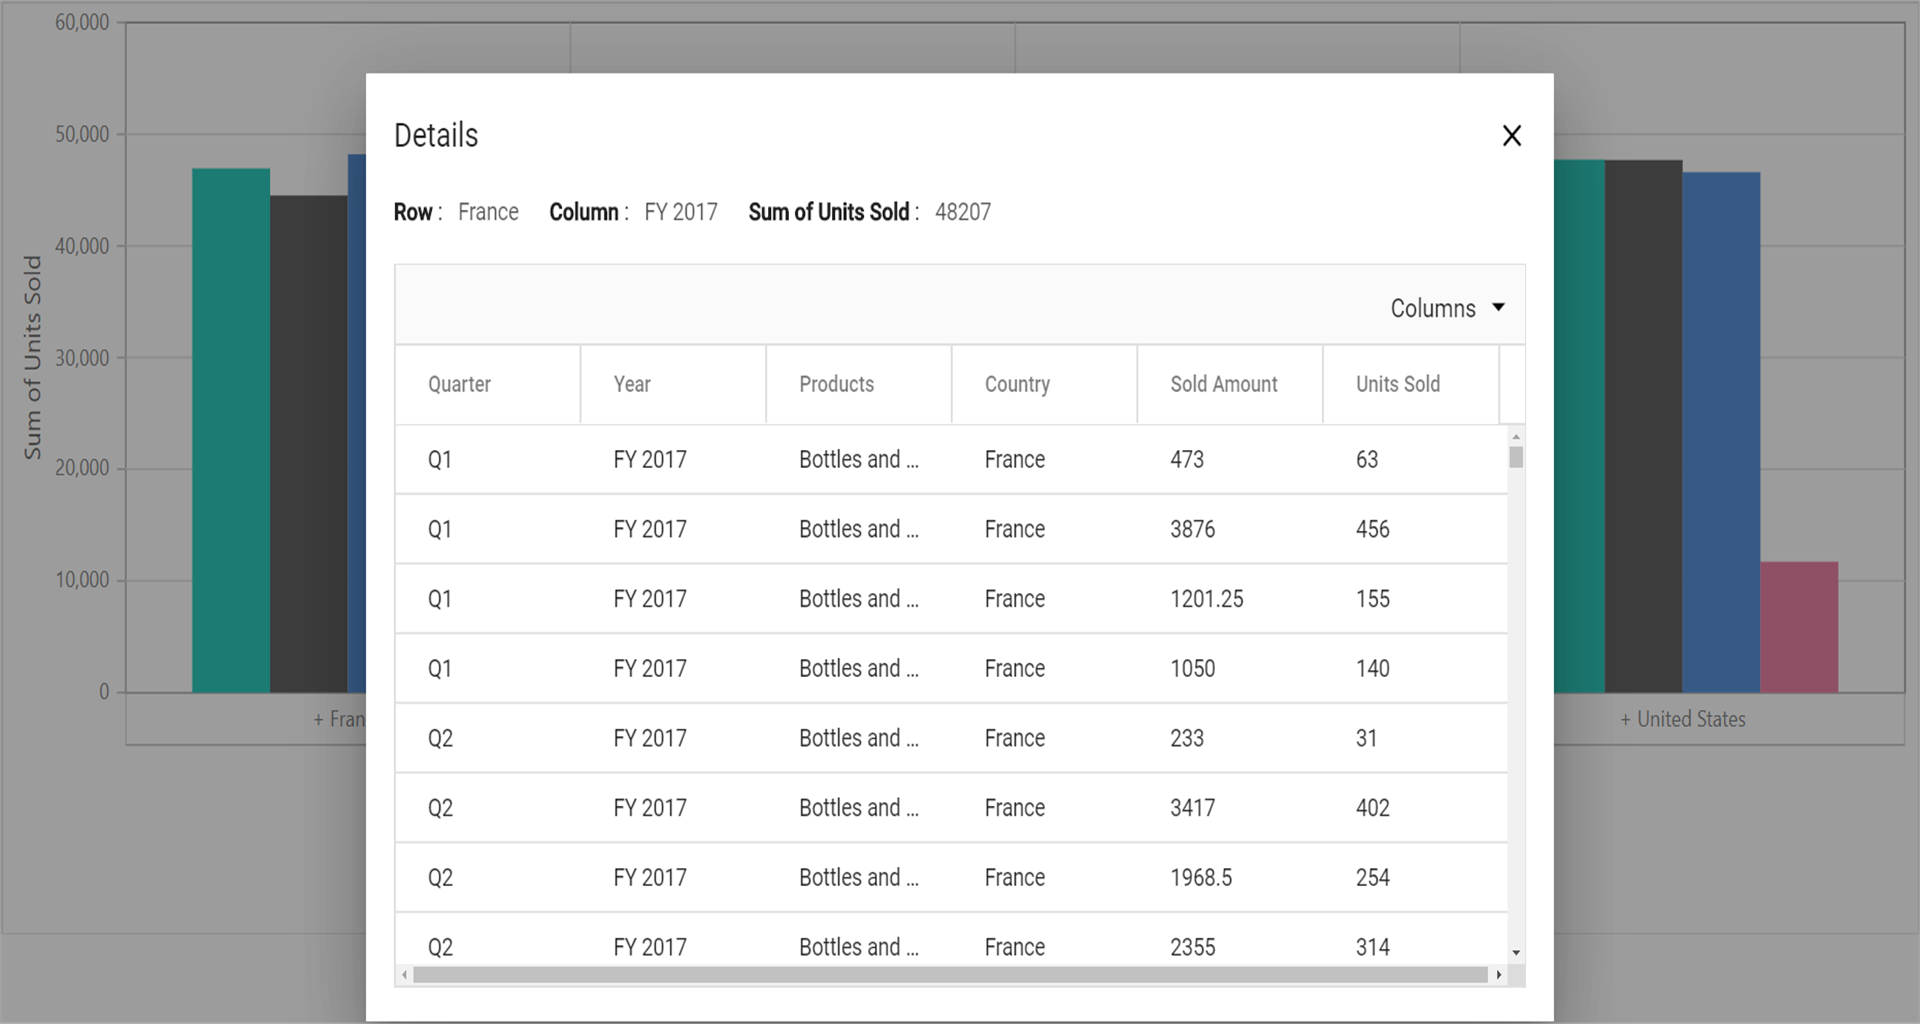
Users can also access drill-through data through the pivot chart. By clicking on any data point in the pivot chart, they can view the raw data in a data grid displayed in a new window.
Below is an example of enabling drill-through with a pivot chart:
@Html.EJS().PivotView("PivotView").Width("100%").Height("300").ShowTooltip(false).DataSourceSettings(dataSource => dataSource.DataSource((IEnumerable<object>)ViewBag.DataSource).ExpandAll(false).EnableSorting(true)
 .FormatSettings(formatsettings =>
 {
     formatsettings.Name("Amount").Format("C0").MaximumSignificantDigits(10).MinimumSignificantDigits(1).UseGrouping(true).Add();
 }).Rows(rows =>
 {
     rows.Name("Country").Add(); rows.Name("Products").Add();
 }).Columns(columns =>
 {
     columns.Name("Year").Caption("Year").Add(); columns.Name("Quarter").Add();
 }).Values(values =>
 {
     values.Name("Sold").Caption("Units Sold").Add(); values.Name("Amount").Caption("Sold Amount").Add();
 })).AllowDrillThrough(true).DisplayOption(new PivotViewDisplayOption { View = View.Chart }).ChartSettings(chartSettings => chartSettings.ChartSeries(chartSeries => chartSeries.Type(ChartSeriesType.Column))).Render()
public ActionResult Index()
{
var data = GetPivotData();
ViewBag.DataSource = data;
return View();
}
Maximum rows to retrieve
This property is applicable only for the OLAP data source.
The MaxRowsInDrillThrough property specifies the maximum number of rows to be returned during a drill-through operation. By default, this property is set to “10000”, meaning that if it is not explicitly defined, up to 10,000 rows will be returned.
@using Syncfusion.EJ2.PivotView

@Html.EJS().PivotView("pivotview").Width("100%").Height("600").ShowFieldList(true).ShowGroupingBar(true).AllowDrillThrough(true).MaxRowsInDrillThrough(10).AllowCalculatedField(true).DataSourceSettings(dataSourceSettings => dataSourceSettings.EnableSorting(true)
        .Url("https://bi.syncfusion.com/olap/msmdpump.dll").Catalog("Adventure Works DW 2008 SE").Cube("Adventure Works").ProviderType(ProviderType.SSAS)
        .Rows(rows => { rows.Name("[Customer].[Customer Geography]").Caption("Customer Geography").Add(); })
        .Columns(columns => { columns.Name("[Product].[Product Categories]").Caption("Product Categories").Add(); columns.Name("[Measures]").Caption("Measures").Add(); })
        .Values(values => { values.Name("[Measures].[Customer Count]").Caption("Customer Count").Add(); values.Name("[Measures].[Internet Sales Amount]").Caption("Internet Sales Amount").Add(); values.Name("Order on Discount").IsCalculatedField(true).Add(); })
        .Filters(filters => { filters.Name("[Date].[Fiscal]").Caption("Date Fiscal").Add(); })
        .FilterSettings(filterSettings =>
        {
            filterSettings.Name("[Date].[Fiscal]").Items(ViewBag.filterMembers).LevelCount(3).Add();
        }).CalculatedFieldSettings(calculatedFieldSettings =>
        {
            calculatedFieldSettings.Name("BikeAndComponents").Formula("([Product].[Product Categories].[Category].[Bikes] + [Product].[Product Categories].[Category].[Components])").HierarchyUniqueName("[Product].[Product Categories]").FormatString("Standard").Add();
            calculatedFieldSettings.Name("Order on Discount").Formula("[Measures].[Order Quantity] + ([Measures].[Order Quantity] * 0.10)").FormatString("Currency").Add();
        })).Render()

<style>
    #pivotview {
        display: block;
    }
</style>
public ActionResult Index()
{
return View();
}
Events
DrillThrough
The DrillThrough event is triggered immediately after a user double-clicks a value cell in the Pivot Table. This event allows users to customize the columns displayed in the drill-through popup’s data grid. It is specifically designed to help users view and process the raw data behind an aggregated value in a value cell. The event includes the following parameters:
-
columnHeaders: Contains the column header of the clicked cell. -
currentCell: Contains details about the clicked cell. -
currentTarget: Contains the HTML element of the clicked cell. -
gridColumns: Specifies the data grid columns to be displayed in the drill-through popup. -
rawData: Contains the raw, unaggregated data for the clicked cell. -
rowHeaders: Contains the row header of the clicked cell. -
value: Contains the value of the clicked cell. -
cancel: It is a boolean property and by setting this to true, dialog won’t be created.
Below is an example of using the DrillThrough event in a Pivot Table:
@Html.EJS().PivotView("PivotView").Width("100%").Height("300").ShowTooltip(false).DataSourceSettings(dataSource => dataSource.DataSource((IEnumerable<object>)ViewBag.DataSource).ExpandAll(false).EnableSorting(true)
 .FormatSettings(formatsettings =>
 {
     formatsettings.Name("Amount").Format("C0").MaximumSignificantDigits(10).MinimumSignificantDigits(1).UseGrouping(true).Add();
 }).Rows(rows =>
 {
     rows.Name("Country").Add(); rows.Name("Products").Add();
 }).Columns(columns =>
 {
     columns.Name("Year").Caption("Year").Add(); columns.Name("Quarter").Add();
 }).Values(values =>
 {
     values.Name("Sold").Caption("Units Sold").Add(); values.Name("Amount").Caption("Sold Amount").Add();
 })).AllowDrillThrough(true).DrillThrough("drillThrough").Render()

<script>
    function drillThrough(args) {
        //triggers on value cell double click
    }
</script>
public ActionResult Index()
{
var data = GetPivotData();
ViewBag.DataSource = data;
return View();
}BeginDrillThrough
The event BeginDrillThrough triggers after a double-click on a value cell in the Pivot Table and fires right after the data grid is initialized in the drill-through popup. This event allows users to interact with the data grid, which displays the raw data behind the aggregated value cell. Users can perform operations such as sorting, grouping, and filtering within the data grid according to their specific needs. The event includes the following parameters:
-
gridObj- It holds the data grid instance to be rendered inside the drill-through popup. -
cellInfo- Gives details about the clicked cell, including rawData (unaggregated data), rowHeaders, columnHeaders, and value.
The following example demonstrates how to enable sorting, filtering, and grouping in the data grid displayed within the drill-through popup. This is achieved by configuring the gridObj in the BeginDrillThrough event.
Gridfeatures are segregated into individual feature-wise modules. For example, to usesortingfeature, you should injectSortusing theGrid.Inject(Sort)section.
@Html.EJS().PivotView("PivotView").Width("100%").Height("300").ShowTooltip(false).DataSourceSettings(dataSource => dataSource.DataSource((IEnumerable<object>)ViewBag.DataSource).ExpandAll(false).EnableSorting(true)
 .FormatSettings(formatsettings =>
 {
     formatsettings.Name("Amount").Format("C0").MaximumSignificantDigits(10).MinimumSignificantDigits(1).UseGrouping(true).Add();
 }).Rows(rows =>
 {
     rows.Name("Country").Add(); rows.Name("Products").Add();
 }).Columns(columns =>
 {
     columns.Name("Year").Caption("Year").Add(); columns.Name("Quarter").Add();
 }).Values(values =>
 {
     values.Name("Sold").Caption("Units Sold").Add(); values.Name("Amount").Caption("Sold Amount").Add();
 })).EditSettings(pivotViewCellEditSettings=>pivotViewCellEditSettings.AllowAdding(true).AllowDeleting(true).AllowEditing(true).Mode(Syncfusion.EJ2.PivotView.EditMode.Normal)).BeginDrillThrough("beginDrillThrough").Render()

<script>
    function beginDrillThrough(args) {
        if (args.gridObj) {
            var gridObj = args.gridObj;
            gridObj.allowGrouping = true;
            gridObj.allowSorting = true;
            gridObj.allowFiltering = true;
            gridObj.filterSettings = { type: 'CheckBox' };
        }
    }
</script>
public ActionResult Index()
{
var data = GetPivotData();
ViewBag.DataSource = data;
return View();
}