Empty Points
4 Sep 202515 minutes to read
The data points those uses the null or undefined as value are considered as empty points. The empty data points are ignored and not plotted in the chart. You can customize those points, using the EmptyPointSettings property in series. The default mode of the empty point is Gap. Other supported modes are Average and Zero.
@Html.EJS().AccumulationChart("container").Series(series =>
            {
                series.DataSource(ViewBag.dataSource)
                  .XName("xValue")
                  .YName("yValue")
                  .Name("Profit")
                  .Type(Syncfusion.EJ2.Charts.AccumulationType.Pie)
                  .DataLabel(ViewBag.datalabel)
                  .EmptyPointSettings(ViewBag.emptypoint).Add();
            })
            .EnableSmartLabels(true)
            .Title("Annual Product-Wise Profit Analysis")
            .LegendSettings(ls => ls.Visible(false))
            .Load("load").Render()
public ActionResult Index()
{
List<EmptyPointsChartData> chartData = new List<EmptyPointsChartData>
{
new EmptyPointsChartData { xValue = "Rice", yValue = 80 },
new EmptyPointsChartData { xValue = "Wheat", yValue = null },
new EmptyPointsChartData { xValue = "Oil", yValue = 70 },
new EmptyPointsChartData { xValue = "Corn", yValue = 60 },
new EmptyPointsChartData { xValue = "Gram", yValue = null },
new EmptyPointsChartData { xValue = "Milk", yValue = 70 },
new EmptyPointsChartData { xValue = "Peas", yValue = 80 },
new EmptyPointsChartData { xValue = "Fruit", yValue = 60 },
new EmptyPointsChartData { xValue = "Butter",yValue = null },
};
ViewBag.dataSource = chartData;
return View();
}
public class EmptyPointsChartData
{
public string xValue;
public Nullable<double> yValue;
}Customization
Specific color for an empty point can be set by using the Fill property in EmptyPointSettings and the
border for an empty point can be set by using the Border property.
@Html.EJS().AccumulationChart("container").Series(series =>
            {
                series.DataSource(ViewBag.dataSource)
                  .XName("xValue")
                  .YName("yValue")
                  .Name("Profit")
                  .Type(Syncfusion.EJ2.Charts.AccumulationType.Pie)
                  .DataLabel(ViewBag.datalabel)
                  .EmptyPointSettings(ViewBag.emptypoint).Add();
            })
            .EnableSmartLabels(true)
            .Title("Annual Product-Wise Profit Analysis")
            .LegendSettings(ls => ls.Visible(false))
            .Load("load").Render()
public ActionResult Index()
{
List<EmptyPointsChartData> chartData = new List<EmptyPointsChartData>
{
new EmptyPointsChartData { xValue = "Rice", yValue = 80 },
new EmptyPointsChartData { xValue = "Wheat", yValue = null },
new EmptyPointsChartData { xValue = "Oil", yValue = 70 },
new EmptyPointsChartData { xValue = "Corn", yValue = 60 },
new EmptyPointsChartData { xValue = "Gram", yValue = null },
new EmptyPointsChartData { xValue = "Milk", yValue = 70 },
new EmptyPointsChartData { xValue = "Peas", yValue = 80 },
new EmptyPointsChartData { xValue = "Fruit", yValue = 60 },
new EmptyPointsChartData { xValue = "Butter",yValue = null },
};
ViewBag.dataSource = chartData;
return View();
}
public class EmptyPointsChartData
{
public string xValue;
public Nullable<double> yValue;
}Handling No Data
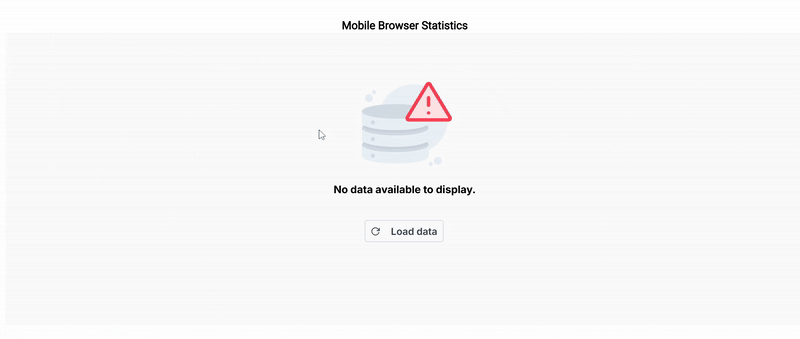
When no data is available to render in the accumulation chart, the NoDataTemplate property can be used to display a custom layout within the chart area. This layout may include a message indicating the absence of data, a relevant image, or a button to initiate data loading. Styled text, images, or interactive elements can be incorporated to maintain design consistency and improve user guidance. Once data becomes available, the chart automatically updates to display the appropriate visualization.
@(Html.EJS().AccumulationChart("container").Series(series => {
    series.DataSource(ViewBag.dataSource)
        .XName("x")
        .YName("y")
        .Name("Browser")
        .Type(Syncfusion.EJ2.Charts.AccumulationType.Pie)
        .ExplodeIndex(0).Add();
})
    .EnableSmartLabels(true)
    .Title("Mobile Browser Statistics").NoDataTemplate("#No-Data-Template").Load("load").Loaded("loaded")
    .LegendSettings(ls => ls.Visible(false)).Render()
)
<style>
    #noDataTemplateContainer {
        height: inherit;
        width: inherit;
    }

    .load-data-btn {
        border-radius: 4px;
        margin-top: 75px;
        display: inline-flex;
        align-items: center;
    }

    .light-bg {
        background-color: #fafafa;
        color: #000000;
    }

    .template-align img {
        max-width: 150px;
    /* Adjust size as needed */
        max-height: 150px;
        margin-top: 55px;
    }

    .template-align {
        display: flex;
        align-items: center;
        justify-content: center;
        text-align: center;
    }

    #control-container {
        padding: 0px !important;
    }

    #noDataButtonOverlay {
        position: absolute;
        top: 60%;
        left: 50%;
        transform: translate(-50%, -50%);
        z-index: 1000;
    }
</style>
    <div id="noDataButtonOverlay" style="display: none;">
        @Html.EJS().Button("loadDataButton").Content("Load data").IconCss("e-icons e-refresh").CssClass("load-data-btn e-outline").IsPrimary(false).HtmlAttributes(new Dictionary<string, object> { { "onclick", "loadChartData()" } }).Render()
    </div>

    <script id='No-Data-Template' type="text/x-template">
        <div id='noDataTemplateContainer' class="light-bg">
            <div class="template-align">
                <img src="no-data.png" alt="No Data" />
            </div>
            <div class="template-align">
                <p style="font-size: 15px; margin: 10px 0 0;"><strong>No data available to display.</strong></p>
            </div>
        </div>
    </script>
    <script>
        var chartData = [
            { x : "Chrome", y : 37 },
            { x : "UC Browser", y : 17 },
            { x : "iPhone", y : 19 },
            { x : "Others", y : 4  },
            { x : "Opera", y : 11 },
            { x : "Android", y : 12 },
        ];
        var dataLoaded = false;

        var load = function (args) {
            args.chart.series[0].dataSource = dataLoaded ? chartData : [];
        };

        var loaded = function (args) {
            var buttonOverlay = document.getElementById("noDataButtonOverlay");
            if (buttonOverlay) {
                buttonOverlay.style.display = !dataLoaded ? 'block' : 'none';
            }
        };

        var loadChartData = function () {
            var chart = document.getElementById('container').ej2_instances[0];
            chart.series[0].dataSource = chartData;
            chart.series[0].animation.enable = true;
            dataLoaded = true;

            // Hide the button overlay when data is loaded
            var buttonOverlay = document.getElementById("noDataButtonOverlay");
            if (buttonOverlay) {
                buttonOverlay.style.display = 'none';
            }

            chart.refresh();
        };
    </script>
public ActionResult Index()
{
return View();
}