Legend in ASP.NET CORE Chart Component
4 Oct 202224 minutes to read
Legend provides information about the series rendered in the chart.
Enable Legend
You can use legend for the chart by setting the visible property to true in legendSettings object.
<ejs-chart id="container" title="Inflation - Consumer Price">
            <e-chart-primaryxaxis valueType="DateTime"
                                  labelFormat="y"
                                  intervalType="Years"></e-chart-primaryxaxis>
            <e-series-collection>
                <e-series dataSource="ViewBag.dataSource" name="Germany" xName="xValue" width="2" opacity="1" yName="yValue" type="@Syncfusion.EJ2.Charts.ChartSeriesType.Line">
                </e-series>
            </e-series-collection>
            <e-chart-legendsettings visible="true"></e-chart-legendsettings>
 </ejs-chart>
public IActionResult Index()
{
List<LineChartData> chartData = new List<LineChartData>
{
new LineChartData { xValue = new DateTime(2005, 01, 01), yValue = 21, yValue1 = 28 },
new LineChartData { xValue = new DateTime(2006, 01, 01), yValue = 24, yValue1 = 44 },
new LineChartData { xValue = new DateTime(2007, 01, 01), yValue = 36, yValue1 = 48 },
new LineChartData { xValue = new DateTime(2008, 01, 01), yValue = 38, yValue1 = 50 },
new LineChartData { xValue = new DateTime(2009, 01, 01), yValue = 54, yValue1 = 66 },
new LineChartData { xValue = new DateTime(2010, 01, 01), yValue = 57, yValue1 = 78 },
new LineChartData { xValue = new DateTime(2011, 01, 01), yValue = 70, yValue1 = 84 },
};
ViewBag.dataSource = chartData;
return View();
}
public class LineChartData
{
public DateTime xValue;
public double yValue;
public double yValue1;
}Position and Alignment
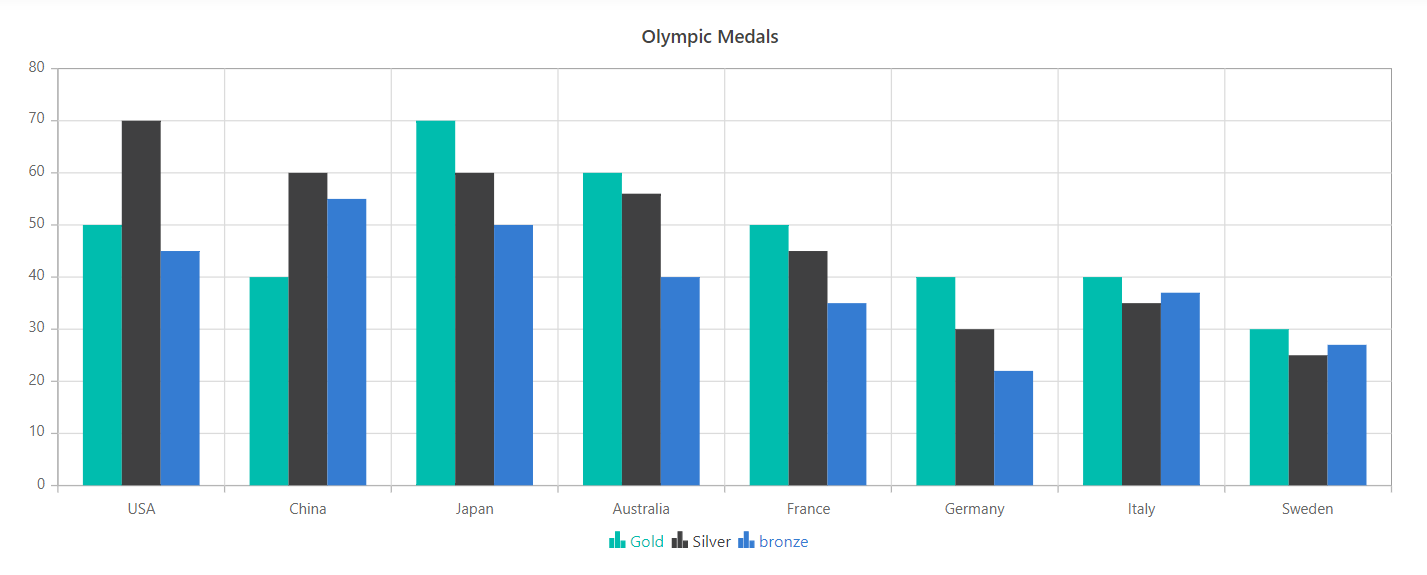
By using the position property, you can position the legend at left, right, top or bottom of the chart. The legend is positioned at the bottom of the chart, by default.
<ejs-chart id="container" title="Olympic Medals">
        <e-chart-legendsettings visible="true" position="Top"></e-chart-legendsettings>
        <e-chart-primaryxaxis valueType="Category"></e-chart-primaryxaxis>
        <e-series-collection>
            <e-series dataSource="ViewBag.dataSource" name="Gold" xName="country" width="2" opacity="1" yName="gold" type="@Syncfusion.EJ2.Charts.ChartSeriesType.Column"></e-series>
            <e-series dataSource="ViewBag.dataSource" name="Silver" xName="country" width="2" opacity="1" yName="silver" type="@Syncfusion.EJ2.Charts.ChartSeriesType.Column"></e-series>
            <e-series dataSource="ViewBag.dataSource" name="bronze" xName="country" width="2" opacity="1" yName="bronze" type="@Syncfusion.EJ2.Charts.ChartSeriesType.Column"></e-series>
        </e-series-collection>
    </ejs-chart>
public IActionResult Index()
{
List<ColumnChartData> chartData = new List<ColumnChartData>
{
new ColumnChartData{ country= "USA", gold=50, silver=70, bronze=45 },
new ColumnChartData{ country="China", gold=40, silver= 60, bronze=55 },
new ColumnChartData{ country= "Japan", gold=70, silver= 60, bronze=50 },
new ColumnChartData{ country= "Australia", gold=60, silver= 56, bronze=40 },
new ColumnChartData{ country= "France", gold=50, silver= 45, bronze=35 },
new ColumnChartData{ country= "Germany", gold=40, silver=30, bronze=22 },
new ColumnChartData{ country= "Italy", gold=40, silver=35, bronze=37 },
new ColumnChartData{ country= "Sweden", gold=30, silver=25, bronze=27 }
};
ViewBag.dataSource = chartData;
return View();
}
public class ColumnChartData
{
public string country;
public double gold;
public double silver;
public double bronze;
}Custom position helps you to position the legend anywhere in the chart using x, y coordinates.
@{
    var location = new Syncfusion.EJ2.Charts.ChartLocation { X = 200, Y = 20 };
}

<ejs-chart id="container" title="Olympic Medals">
    <e-chart-legendsettings visible="true" position="Custom" location="location"></e-chart-legendsettings>
    <e-chart-primaryxaxis valueType="Category"></e-chart-primaryxaxis>
    <e-series-collection>
        <e-series dataSource="ViewBag.dataSource" name="Gold" xName="country" width="2" opacity="1" yName="gold" type="@Syncfusion.EJ2.Charts.ChartSeriesType.Column"></e-series>
        <e-series dataSource="ViewBag.dataSource" name="Silver" xName="country" width="2" opacity="1" yName="silver" type="@Syncfusion.EJ2.Charts.ChartSeriesType.Column"></e-series>
        <e-series dataSource="ViewBag.dataSource" name="bronze" xName="country" width="2" opacity="1" yName="bronze" type="@Syncfusion.EJ2.Charts.ChartSeriesType.Column"></e-series>
    </e-series-collection>
</ejs-chart>
public IActionResult Index()
{
List chartData = new List
{
new LineChartData { xValue = new DateTime(2005, 01, 01), yValue = 21, yValue1 = 28 },
new LineChartData { xValue = new DateTime(2006, 01, 01), yValue = 24, yValue1 = 44 },
new LineChartData { xValue = new DateTime(2007, 01, 01), yValue = 36, yValue1 = 48 },
new LineChartData { xValue = new DateTime(2008, 01, 01), yValue = 38, yValue1 = 50 },
new LineChartData { xValue = new DateTime(2009, 01, 01), yValue = 54, yValue1 = 66 },
new LineChartData { xValue = new DateTime(2010, 01, 01), yValue = 57, yValue1 = 78 },
new LineChartData { xValue = new DateTime(2011, 01, 01), yValue = 70, yValue1 = 84 },
};
ViewBag.dataSource = chartData;
return View();
}
public class LineChartData
{
public DateTime xValue;
public double yValue;
public double yValue1;
}Legend Reverse
You can reverse the order of the legend items by using the reverse property. By default, legend for the first series in the collection will be placed first.
<ejs-chart id="container" title="Olympic Medal Counts - RIO">
    <e-chart-primaryxaxis valueType="Category" interval=1>
        <e-majorgridlines width="0"></e-majorgridlines>
    </e-chart-primaryxaxis>
    <e-chart-primaryyaxis>
        <e-majorgridlines width="0"></e-majorgridlines>
        <e-majorticklines width="0"></e-majorticklines>
        <e-linestyle width="0"></e-linestyle>
        <e-labelstyle color="transparent"></e-labelstyle>
    </e-chart-primaryyaxis>
    <e-chart-chartarea>
        <e-chartarea-border width="0"></e-chartarea-border>
    </e-chart-chartarea>
    <e-series-collection>
        <e-series dataSource="ViewBag.dataSource" xName='x' yName='yValue' name='Gold' width=2 type="@Syncfusion.EJ2.Charts.ChartSeriesType.Column">
        </e-series>
        <e-series dataSource="ViewBag.dataSource" xName='x' yName='yValue1' name='Silver' width=2 type="@Syncfusion.EJ2.Charts.ChartSeriesType.Column">
        </e-series>
        <e-series dataSource="ViewBag.dataSource" xName='x' yName='yValue2' name='Bronze' width=2 type="@Syncfusion.EJ2.Charts.ChartSeriesType.Column">
        </e-series>
    </e-series-collection>
    <e-chart-legendsettings reverse="true"></e-chart-legendsettings>
</ejs-chart>
public IActionResult Index()
{
List<ColumnChartData> chartData = new List<ColumnChartData>
{
new ColumnChartData { x= "USA", yValue= 46, yValue1=37, yValue2=38 },
new ColumnChartData { x= "GBR", yValue= 27, yValue1=23, yValue2=17 },
new ColumnChartData { x= "CHN", yValue= 26, yValue1=18, yValue2=26 }
};
ViewBag.dataSource = chartData;
return View();
}
public class ColumnChartData
{
public string x;
public double yValue;
public double yValue1;
public double yValue2;
}Legend Alignment
You can align the legend as center, far or near to the chart using alignment property.
@{
   var location = new { x = 200, y = 20 };
}
<ejs-chart id="container" title="Olympic Medals">
        <e-chart-legendsettings visible="true" alignment="Far"></e-chart-legendsettings>
        <e-chart-primaryxaxis valueType="Category"></e-chart-primaryxaxis>
        <e-series-collection>
            <e-series dataSource="ViewBag.dataSource" name="Gold" xName="country" width="2" opacity="1" yName="gold" type="@Syncfusion.EJ2.Charts.ChartSeriesType.Column"></e-series>
            <e-series dataSource="ViewBag.dataSource" name="Silver" xName="country" width="2" opacity="1" yName="silver" type="@Syncfusion.EJ2.Charts.ChartSeriesType.Column"></e-series>
            <e-series dataSource="ViewBag.dataSource" name="bronze" xName="country" width="2" opacity="1" yName="bronze" type="@Syncfusion.EJ2.Charts.ChartSeriesType.Column"></e-series>
        </e-series-collection>
    </ejs-chart>
public IActionResult Index()
{
List<ColumnChartData> chartData = new List<ColumnChartData>
{
new ColumnChartData{ country= "USA", gold=50, silver=70, bronze=45 },
new ColumnChartData{ country="China", gold=40, silver= 60, bronze=55 },
new ColumnChartData{ country= "Japan", gold=70, silver= 60, bronze=50 },
new ColumnChartData{ country= "Australia", gold=60, silver= 56, bronze=40 },
new ColumnChartData{ country= "France", gold=50, silver= 45, bronze=35 },
new ColumnChartData{ country= "Germany", gold=40, silver=30, bronze=22 },
new ColumnChartData{ country= "Italy", gold=40, silver=35, bronze=37 },
new ColumnChartData{ country= "Sweden", gold=30, silver=25, bronze=27 }
};
ViewBag.dataSource = chartData;
return View();
}
public class ColumnChartData
{
public string country;
public double gold;
public double silver;
public double bronze;
}Customization
To change the legend icon shape, you can use legendShape property in the series. By default, legend icon shape is seriesType.
<ejs-chart id="container" title="Olympic Medals">
        <e-chart-legendsettings visible="true"></e-chart-legendsettings>
        <e-chart-primaryxaxis valueType="Category"></e-chart-primaryxaxis>
        <e-series-collection>
            <e-series dataSource="ViewBag.dataSource" name="Gold" xName="country" width="2" opacity="1" yName="gold" type="@Syncfusion.EJ2.Charts.ChartSeriesType.Column"
                      legendShape="Circle"></e-series>
            <e-series dataSource="ViewBag.dataSource" name="Silver" xName="country" width="2" opacity="1" yName="silver" type="@Syncfusion.EJ2.Charts.ChartSeriesType.Column"
                      legendShape="SeriesType"></e-series>
            <e-series dataSource="ViewBag.dataSource" name="bronze" xName="country" width="2" opacity="1" yName="bronze" type="@Syncfusion.EJ2.Charts.ChartSeriesType.Column"
                      legendShape="Diamond"></e-series>
        </e-series-collection>
    </ejs-chart>
public IActionResult Index()
{
List<ColumnChartData> chartData = new List<ColumnChartData>
{
new ColumnChartData{ country= "USA", gold=50, silver=70, bronze=45 },
new ColumnChartData{ country="China", gold=40, silver= 60, bronze=55 },
new ColumnChartData{ country= "Japan", gold=70, silver= 60, bronze=50 },
new ColumnChartData{ country= "Australia", gold=60, silver= 56, bronze=40 },
new ColumnChartData{ country= "France", gold=50, silver= 45, bronze=35 },
new ColumnChartData{ country= "Germany", gold=40, silver=30, bronze=22 },
new ColumnChartData{ country= "Italy", gold=40, silver=35, bronze=37 },
new ColumnChartData{ country= "Sweden", gold=30, silver=25, bronze=27 }
};
ViewBag.dataSource = chartData;
return View();
}
public class ColumnChartData
{
public string country;
public double gold;
public double silver;
public double bronze;
}Legend Size
By default, legend takes 20% - 25% of the chart’s height horizontally, when it is placed on top or bottom position and 20% - 25% of the chart’s width vertically, when placed on left or right position of the chart. You can change this default legend size by using the width and height property of the legendSettings.
@{
 var border = new { color = "red", width = 3 };
}
<ejs-chart id="container" title="Olympic Medals">
        <e-chart-legendsettings visible="true" width="300" height="50" border="border"></e-chart-legendsettings>
        <e-chart-primaryxaxis valueType="Category"></e-chart-primaryxaxis>
        <e-series-collection>
            <e-series dataSource="ViewBag.dataSource" name="Gold" xName="country" width="2" opacity="1" yName="gold" type="@Syncfusion.EJ2.Charts.ChartSeriesType.Column"
                      legendShape="Circle"></e-series>
            <e-series dataSource="ViewBag.dataSource" name="Silver" xName="country" width="2" opacity="1" yName="silver" type="@Syncfusion.EJ2.Charts.ChartSeriesType.Column"
                      legendShape="SeriesType"></e-series>
            <e-series dataSource="ViewBag.dataSource" name="bronze" xName="country" width="2" opacity="1" yName="bronze" type="@Syncfusion.EJ2.Charts.ChartSeriesType.Column"
                      legendShape="Diamond"></e-series>
        </e-series-collection>
    </ejs-chart>
public IActionResult Index()
{
List<ColumnChartData> chartData = new List<ColumnChartData>
{
new ColumnChartData{ country= "USA", gold=50, silver=70, bronze=45 },
new ColumnChartData{ country="China", gold=40, silver= 60, bronze=55 },
new ColumnChartData{ country= "Japan", gold=70, silver= 60, bronze=50 },
new ColumnChartData{ country= "Australia", gold=60, silver= 56, bronze=40 },
new ColumnChartData{ country= "France", gold=50, silver= 45, bronze=35 },
new ColumnChartData{ country= "Germany", gold=40, silver=30, bronze=22 },
new ColumnChartData{ country= "Italy", gold=40, silver=35, bronze=37 },
new ColumnChartData{ country= "Sweden", gold=30, silver=25, bronze=27 }
};
ViewBag.dataSource = chartData;
return View();
}
public class ColumnChartData
{
public string country;
public double gold;
public double silver;
public double bronze;
}Legend Item Size
You can customize the size of the legend items by using the shapeHeight and shapeWidth property.
<ejs-chart id="container" title="Olympic Medals">
        <e-chart-legendsettings visible="true" shapeHeight="20" shapeWidth="20"></e-chart-legendsettings>
        <e-chart-primaryxaxis valueType="Category"></e-chart-primaryxaxis>
        <e-series-collection>
            <e-series dataSource="ViewBag.dataSource" name="Gold" xName="country" width="2" opacity="1" yName="gold" type="@Syncfusion.EJ2.Charts.ChartSeriesType.Column"
                      legendShape="Circle"></e-series>
            <e-series dataSource="ViewBag.dataSource" name="Silver" xName="country" width="2" opacity="1" yName="silver" type="@Syncfusion.EJ2.Charts.ChartSeriesType.Column"
                      legendShape="Circle"></e-series>
            <e-series dataSource="ViewBag.dataSource" name="bronze" xName="country" width="2" opacity="1" yName="bronze" type="@Syncfusion.EJ2.Charts.ChartSeriesType.Column"
                      legendShape="Circle"></e-series>
        </e-series-collection>
    </ejs-chart>
public IActionResult Index()
{
List<ColumnChartData> chartData = new List<ColumnChartData>
{
new ColumnChartData{ country= "USA", gold=50, silver=70, bronze=45 },
new ColumnChartData{ country="China", gold=40, silver= 60, bronze=55 },
new ColumnChartData{ country= "Japan", gold=70, silver= 60, bronze=50 },
new ColumnChartData{ country= "Australia", gold=60, silver= 56, bronze=40 },
new ColumnChartData{ country= "France", gold=50, silver= 45, bronze=35 },
new ColumnChartData{ country= "Germany", gold=40, silver=30, bronze=22 },
new ColumnChartData{ country= "Italy", gold=40, silver=35, bronze=37 },
new ColumnChartData{ country= "Sweden", gold=30, silver=25, bronze=27 }
};
ViewBag.dataSource = chartData;
return View();
}
public class ColumnChartData
{
public string country;
public double gold;
public double silver;
public double bronze;
}Paging for Legend
Paging will be enabled by default, when the legend items exceeds the legend bounds. You can view each legend items by navigating between the pages using navigation buttons.
@{
    var border = new { color = "red", width = 3 };
}
<ejs-chart id="container" title="Olympic Medals">
        <e-chart-legendsettings visible="true" width="100" height="70" padding="10" shapePadding="10" border="border"></e-chart-legendsettings>
        <e-chart-primaryxaxis valueType="Category"></e-chart-primaryxaxis>
        <e-series-collection>
            <e-series dataSource="ViewBag.dataSource" name="Gold" xName="country" width="2" opacity="1" yName="gold" type="@Syncfusion.EJ2.Charts.ChartSeriesType.Column"
                      legendShape="Circle"></e-series>
            <e-series dataSource="ViewBag.dataSource" name="Silver" xName="country" width="2" opacity="1" yName="silver" type="@Syncfusion.EJ2.Charts.ChartSeriesType.Column"
                      legendShape="Circle"></e-series>
            <e-series dataSource="ViewBag.dataSource" name="bronze" xName="country" width="2" opacity="1" yName="bronze" type="@Syncfusion.EJ2.Charts.ChartSeriesType.Column"
                      legendShape="Circle"></e-series>
        </e-series-collection>
</ejs-chart>
public IActionResult Index()
{
List<ColumnChartData> chartData = new List<ColumnChartData>
{
new ColumnChartData{ country= "USA", gold=50, silver=70, bronze=45 },
new ColumnChartData{ country="China", gold=40, silver= 60, bronze=55 },
new ColumnChartData{ country= "Japan", gold=70, silver= 60, bronze=50 },
new ColumnChartData{ country= "Australia", gold=60, silver= 56, bronze=40 },
new ColumnChartData{ country= "France", gold=50, silver= 45, bronze=35 },
new ColumnChartData{ country= "Germany", gold=40, silver=30, bronze=22 },
new ColumnChartData{ country= "Italy", gold=40, silver=35, bronze=37 },
new ColumnChartData{ country= "Sweden", gold=30, silver=25, bronze=27 }
};
ViewBag.dataSource = chartData;
return View();
}
public class ColumnChartData
{
public string country;
public double gold;
public double silver;
public double bronze;
}Legend Text Wrap
When the legend text exceed the container, the text can be wrapped by using the textWrap property. End user can also wrap the legend text based on the maximumLabelWidth property.
<ejs-chart id="container" title="Olympic Medals">
        <e-chart-legendsettings visible="true" position="Right" maximumLabelWidth="50" textWrap="@Syncfusion.EJ2.Charts.TextWrap.Wrap"></e-chart-legendsettings>
        <e-chart-primaryxaxis valueType="Category"></e-chart-primaryxaxis>
        <e-series-collection>
            <e-series dataSource="ViewBag.dataSource" name="Gold Medals" xName="country" width="2" opacity="1" yName="gold" type="@Syncfusion.EJ2.Charts.ChartSeriesType.Column"
                      legendShape="Circle"></e-series>
            <e-series dataSource="ViewBag.dataSource" name="Silver Medals" xName="country" width="2" opacity="1" yName="silver" type="@Syncfusion.EJ2.Charts.ChartSeriesType.Column"
                      legendShape="Circle"></e-series>
            <e-series dataSource="ViewBag.dataSource" name="Bronze Medals" xName="country" width="2" opacity="1" yName="bronze" type="@Syncfusion.EJ2.Charts.ChartSeriesType.Column"
                      legendShape="Circle"></e-series>
        </e-series-collection>
</ejs-chart>
public IActionResult Index()
{
List<ColumnChartData> chartData = new List<ColumnChartData>
{
new ColumnChartData{ country= "USA", gold=50, silver=70, bronze=45 },
new ColumnChartData{ country="China", gold=40, silver= 60, bronze=55 },
new ColumnChartData{ country= "Japan", gold=70, silver= 60, bronze=50 },
new ColumnChartData{ country= "Australia", gold=60, silver= 56, bronze=40 },
new ColumnChartData{ country= "France", gold=50, silver= 45, bronze=35 },
new ColumnChartData{ country= "Germany", gold=40, silver=30, bronze=22 },
new ColumnChartData{ country= "Italy", gold=40, silver=35, bronze=37 },
new ColumnChartData{ country= "Sweden", gold=30, silver=25, bronze=27 }
};
ViewBag.dataSource = chartData;
return View();
}
public class ColumnChartData
{
public string country;
public double gold;
public double silver;
public double bronze;
}Set the label color based on series color
You can set the legend label color based on series color by using chart’s loaded event.
<ejs-chart id="charts" title="Olympic Medals" loaded="onChartLoaded">
        <e-chart-primaryxaxis valueType="Category"></e-chart-primaryxaxis>
        <e-series-collection>
            <e-series dataSource="ViewBag.dataSource" name="Gold" xName="country" width="2" opacity="1" yName="gold" type="@Syncfusion.EJ2.Charts.ChartSeriesType.Column"></e-series>
            <e-series dataSource="ViewBag.dataSource" name="Silver" xName="country" width="2" opacity="1" yName="silver" type="@Syncfusion.EJ2.Charts.ChartSeriesType.Column"></e-series>
            <e-series dataSource="ViewBag.dataSource" name="bronze" xName="country" width="2" opacity="1" yName="bronze" type="@Syncfusion.EJ2.Charts.ChartSeriesType.Column"></e-series>
        </e-series-collection>
    </ejs-chart>

<script type="text/javascript">
    var colors = ['#00BDAE', '#404041', '#357CD2'];

    function onChartLoaded(args) {
        let chart = document.querySelector('.e-chart');
        let legendTextCol = chart.querySelectorAll('[id*="chart_legend_text_"]');
        for (let i = 0; i < legendTextCol.length; i++) {
            //set the color to legend label
            legendTextCol[i].setAttribute('fill', colors[i]);
        }
    }
</script>
public IActionResult Index()
{
List<ColumnChartData> chartData = new List<ColumnChartData>
{
new ColumnChartData{ country= "USA", gold=50, silver=70, bronze=45 },
new ColumnChartData{ country="China", gold=40, silver= 60, bronze=55 },
new ColumnChartData{ country= "Japan", gold=70, silver= 60, bronze=50 },
new ColumnChartData{ country= "Australia", gold=60, silver= 56, bronze=40 },
new ColumnChartData{ country= "France", gold=50, silver= 45, bronze=35 },
new ColumnChartData{ country= "Germany", gold=40, silver=30, bronze=22 },
new ColumnChartData{ country= "Italy", gold=40, silver=35, bronze=37 },
new ColumnChartData{ country= "Sweden", gold=30, silver=25, bronze=27 }
};
ViewBag.dataSource = chartData;
return View();
}
public class ColumnChartData
{
public string country;
public double gold;
public double silver;
public double bronze;
}
Series Selection on Legend
By default, legend click enables to collapse the series visibility. On other hand, if you need to select a series through legend click, disable the toggleVisibility.
<ejs-chart id="container" title="Olympic Medals" selectionMode="Series">
        <e-chart-legendsettings visible="true" toggleVisibility="false"></e-chart-legendsettings>
        <e-chart-primaryxaxis valueType="Category"></e-chart-primaryxaxis>
        <e-series-collection>
            <e-series dataSource="ViewBag.dataSource" name="Gold" xName="country" width="2" opacity="1" yName="gold" type="@Syncfusion.EJ2.Charts.ChartSeriesType.Column"></e-series>
            <e-series dataSource="ViewBag.dataSource" name="Silver" xName="country" width="2" opacity="1" yName="silver" type="@Syncfusion.EJ2.Charts.ChartSeriesType.Column"></e-series>
            <e-series dataSource="ViewBag.dataSource" name="bronze" xName="country" width="2" opacity="1" yName="bronze" type="@Syncfusion.EJ2.Charts.ChartSeriesType.Column"></e-series>
        </e-series-collection>
    </ejs-chart>
public IActionResult Index()
{
List<ColumnChartData> chartData = new List<ColumnChartData>
{
new ColumnChartData{ country= "USA", gold=50, silver=70, bronze=45 },
new ColumnChartData{ country="China", gold=40, silver= 60, bronze=55 },
new ColumnChartData{ country= "Japan", gold=70, silver= 60, bronze=50 },
new ColumnChartData{ country= "Australia", gold=60, silver= 56, bronze=40 },
new ColumnChartData{ country= "France", gold=50, silver= 45, bronze=35 },
new ColumnChartData{ country= "Germany", gold=40, silver=30, bronze=22 },
new ColumnChartData{ country= "Italy", gold=40, silver=35, bronze=37 },
new ColumnChartData{ country= "Sweden", gold=30, silver=25, bronze=27 }
};
ViewBag.dataSource = chartData;
return View();
}
public class ColumnChartData
{
public string country;
public double gold;
public double silver;
public double bronze;
}Enable Animation
You can customize the animation while clicking legend by setting enableAnimation as true or false using enableAnimation property in chart.
<ejs-chart id="container" enableAnimation="true">
    <e-chart-primaryyaxis valueType="Category">
        <e-majorgridlines width="0"></e-majorgridlines>
        <e-majorticklines width="0"></e-majorticklines>
        <e-linestyle width="0"></e-linestyle>
        <e-labelstyle color="transparent"></e-labelstyle>
    </e-chart-primaryyaxis>
    <e-chart-primaryxaxis interval="1" valueType="Category">
        <e-majorgridlines width="0"></e-majorgridlines>
    </e-chart-primaryxaxis>
    <e-series-collection>
        <e-series dataSource="ViewBag.dataSource" name="Gold" xName="x" yName="y" type="@Syncfusion.EJ2.Charts.ChartSeriesType.Column">
            <e-series-marker visible="false">
                <e-series-datalabel visible="true" position="@Syncfusion.EJ2.Charts.LabelPosition.Top"></e-series-datalabel>
            </e-series-marker>
        </e-series>
        <e-series dataSource="ViewBag.dataSource1" name="Silver" xName="x" yName="y" type="@Syncfusion.EJ2.Charts.ChartSeriesType.Column">
            <e-series-marker visible="false">
                <e-series-datalabel visible="true" position="@Syncfusion.EJ2.Charts.LabelPosition.Top"></e-series-datalabel>
            </e-series-marker>
        </e-series>
        <e-series dataSource="ViewBag.dataSource2" name="Bronze" xName="x" yName="y" type="@Syncfusion.EJ2.Charts.ChartSeriesType.Column">
            <e-series-marker visible="false">
                <e-series-datalabel visible="true" position="@Syncfusion.EJ2.Charts.LabelPosition.Top"></e-series-datalabel>
            </e-series-marker>
        </e-series>
    </e-series-collection>
</ejs-chart>
public ActionResult Index()
{
List<ColumnChartData> chartData1 = new List<ColumnChartData>
{
new ColumnChartData {x="USA", y=46},
new ColumnChartData {x="GBR", y=27},
new ColumnChartData {x="CHN", y=26}
};
List<ColumnChartData> chartData2 = new List<ColumnChartData>
{
new ColumnChartData {x="USA", y=37},
new ColumnChartData {x="GBR", y=23},
new ColumnChartData {x="CHN", y=18}
};
List<ColumnChartData> chartData3 = new List<ColumnChartData>
{
new ColumnChartData {x="USA", y=38},
new ColumnChartData {x="GBR", y=17},
new ColumnChartData {x="CHN", y=26}
};
ViewBag.dataSource = chartData1;
ViewBag.dataSource1 = chartData2;
ViewBag.dataSource2 = chartData3;
return View();
}
public class ColumnChartData
{
public string x;
public double y;
}Collapsing Legend Item
By default, series name will be displayed as legend. To skip the legend for a particular series, you can give empty string to the series name.
<ejs-chart id="container" title="Olympic Medals">
        <e-chart-legendsettings visible="true" toggleVisibility="true"></e-chart-legendsettings>
        <e-chart-primaryxaxis valueType="Category"></e-chart-primaryxaxis>
        <e-series-collection>
            <e-series dataSource="ViewBag.dataSource" name="Gold" xName="country" width="2" opacity="1" yName="gold" type="@Syncfusion.EJ2.Charts.ChartSeriesType.Column"></e-series>
            <e-series dataSource="ViewBag.dataSource" name="Silver" xName="country" width="2" opacity="1" yName="silver" type="@Syncfusion.EJ2.Charts.ChartSeriesType.Column"></e-series>
            <e-series dataSource="ViewBag.dataSource" name="bronze" xName="country" width="2" opacity="1" yName="bronze" type="@Syncfusion.EJ2.Charts.ChartSeriesType.Column"></e-series>
        </e-series-collection>
    </ejs-chart>
public IActionResult Index()
{
List<ColumnChartData> chartData = new List<ColumnChartData>
{
new ColumnChartData{ country= "USA", gold=50, silver=70, bronze=45 },
new ColumnChartData{ country="China", gold=40, silver= 60, bronze=55 },
new ColumnChartData{ country= "Japan", gold=70, silver= 60, bronze=50 },
new ColumnChartData{ country= "Australia", gold=60, silver= 56, bronze=40 },
new ColumnChartData{ country= "France", gold=50, silver= 45, bronze=35 },
new ColumnChartData{ country= "Germany", gold=40, silver=30, bronze=22 },
new ColumnChartData{ country= "Italy", gold=40, silver=35, bronze=37 },
new ColumnChartData{ country= "Sweden", gold=30, silver=25, bronze=27 }
};
ViewBag.dataSource = chartData;
return View();
}
public class ColumnChartData
{
public string country;
public double gold;
public double silver;
public double bronze;
}Legend Title
You can set title for legend using Title property in LegendSettings. You can also customize the FontStyle, Size, FontWeight, Color, TextAlignment, FontFamily, Opacity and TextOverflow of legend title. TitlePosition is used to set the legend position in Top, Left and Right position. MaximumTitleWidth is used to set the width of the legend title. By default, it will be 100px.
<ejs-chart id="container" width="60%">
    <e-primaryxaxis valueType="DateTime" labelFormat="y" rangePadding="Additional"></e-primaryxaxis>
    <e-primaryyaxis labelFormat="{value}%" rangePadding="None" minimum=0 maximum=100  interval=20></e-primaryyaxis>
    <e-series-collection>
        <e-series dataSource="ViewBag.dataSource" marker="marker" name="Germany" xName="xValue" width="2" opacity="1" yName="yValue" type="@Syncfusion.EJ2.Charts.ChartSeriesType.Line"></e-series>
        <e-series dataSource="ViewBag.dataSource" marker="marker" name="England" xName="xValue" width="2" opacity="1" yName="yValue1" type="@Syncfusion.EJ2.Charts.ChartSeriesType.Line"></e-series>
        <e-series dataSource="ViewBag.dataSource" marker="marker" name="Russia" xName="xValue" yName="yValue1" type="@Syncfusion.EJ2.Charts.ChartSeriesType.Column"></e-series>
    </e-series-collection>
    <e-chart-legend-settings position="Bottom" title="Inflation - Consumer Price"><e-chart-legend-settings>
</ejs-chart>
public IActionResult Index()
{
List chartData = new List
{
new LineChartData { xValue = new DateTime(2005, 01, 01), yValue = 21, yValue1 = 28 },
new LineChartData { xValue = new DateTime(2006, 01, 01), yValue = 24, yValue1 = 44 },
new LineChartData { xValue = new DateTime(2007, 01, 01), yValue = 36, yValue1 = 48 },
new LineChartData { xValue = new DateTime(2008, 01, 01), yValue = 38, yValue1 = 50 },
new LineChartData { xValue = new DateTime(2009, 01, 01), yValue = 54, yValue1 = 66 },
new LineChartData { xValue = new DateTime(2010, 01, 01), yValue = 57, yValue1 = 78 },
new LineChartData { xValue = new DateTime(2011, 01, 01), yValue = 70, yValue1 = 84 },
};
ViewBag.dataSource = chartData;
return View();
}
public class LineChartData
{
public DateTime xValue;
public double yValue;
public double yValue1;
}Arrow Page Navigation
By default, the page number will be enabled while legend paging. Now, you can disable that page number and also you can get left and right arrows for page navigation. You have to set false value to EnablePages to get this support.
<ejs-chart id="container"  title="Inflation - Consumer Price" width="60%">
    <e-primaryxaxis valueType="DateTime" labelFormat="y" rangePadding="Additional"></e-primaryxaxis>
    <e-primaryyaxis labelFormat="{value}%" rangePadding="None" minimum=0 maximum=100  interval=20></e-primaryyaxis>
    <e-series-collection>
        <e-series dataSource="ViewBag.dataSource" marker="marker" name="Germany" xName="xValue" width="2" opacity="1" yName="yValue" type="@Syncfusion.EJ2.Charts.ChartSeriesType.Line"></e-series>
        <e-series dataSource="ViewBag.dataSource" marker="marker" name="England" xName="xValue" width="2" opacity="1" yName="yValue1" type="@Syncfusion.EJ2.Charts.ChartSeriesType.Line"></e-series>
        <e-series dataSource="ViewBag.dataSource" marker="marker" name="Russia" xName="xValue" yName="yValue1" type="@Syncfusion.EJ2.Charts.ChartSeriesType.Column"></e-series>
    </e-series-collection>
    <e-chart-legend-settings position="Bottom" enablePages="false"><e-chart-legend-settings>
</ejs-chart>
public IActionResult Index()
{
List chartData = new List
{
new LineChartData { xValue = new DateTime(2005, 01, 01), yValue = 21, yValue1 = 28 },
new LineChartData { xValue = new DateTime(2006, 01, 01), yValue = 24, yValue1 = 44 },
new LineChartData { xValue = new DateTime(2007, 01, 01), yValue = 36, yValue1 = 48 },
new LineChartData { xValue = new DateTime(2008, 01, 01), yValue = 38, yValue1 = 50 },
new LineChartData { xValue = new DateTime(2009, 01, 01), yValue = 54, yValue1 = 66 },
new LineChartData { xValue = new DateTime(2010, 01, 01), yValue = 57, yValue1 = 78 },
new LineChartData { xValue = new DateTime(2011, 01, 01), yValue = 70, yValue1 = 84 },
};
ViewBag.dataSource = chartData;
return View();
}
public class LineChartData
{
public DateTime xValue;
public double yValue;
public double yValue1;
}Legend Item Padding
The itemPadding property can be used to adjust the space between the legend items.
<ejs-chart id="container"  title="Inflation - Consumer Price" width="60%">
    <e-primaryxaxis valueType="DateTime" labelFormat="y" rangePadding="Additional"></e-primaryxaxis>
    <e-primaryyaxis labelFormat="{value}%" rangePadding="None" minimum=0 maximum=100  interval=20></e-primaryyaxis>
    <e-series-collection>
        <e-series dataSource="ViewBag.dataSource" marker="marker" name="Germany" xName="xValue" width="2" opacity="1" yName="yValue" type="@Syncfusion.EJ2.Charts.ChartSeriesType.Line"></e-series>
        <e-series dataSource="ViewBag.dataSource" marker="marker" name="England" xName="xValue" width="2" opacity="1" yName="yValue1" type="@Syncfusion.EJ2.Charts.ChartSeriesType.Line"></e-series>
        <e-series dataSource="ViewBag.dataSource" marker="marker" name="Russia" xName="xValue" yName="yValue1" type="@Syncfusion.EJ2.Charts.ChartSeriesType.Column"></e-series>
    </e-series-collection>
    <e-chart-legend-settings position="Bottom" enablePages="false" itemPadding= 30><e-chart-legend-settings>
</ejs-chart>
public IActionResult Index()
{
List chartData = new List
{
new LineChartData { xValue = new DateTime(2005, 01, 01), yValue = 21, yValue1 = 28 },
new LineChartData { xValue = new DateTime(2006, 01, 01), yValue = 24, yValue1 = 44 },
new LineChartData { xValue = new DateTime(2007, 01, 01), yValue = 36, yValue1 = 48 },
new LineChartData { xValue = new DateTime(2008, 01, 01), yValue = 38, yValue1 = 50 },
new LineChartData { xValue = new DateTime(2009, 01, 01), yValue = 54, yValue1 = 66 },
new LineChartData { xValue = new DateTime(2010, 01, 01), yValue = 57, yValue1 = 78 },
new LineChartData { xValue = new DateTime(2011, 01, 01), yValue = 70, yValue1 = 84 },
};
ViewBag.dataSource = chartData;
return View();
}
public class LineChartData
{
public DateTime xValue;
public double yValue;
public double yValue1;
}