Data label in Bullet Chart Control
24 Jun 20243 minutes to read
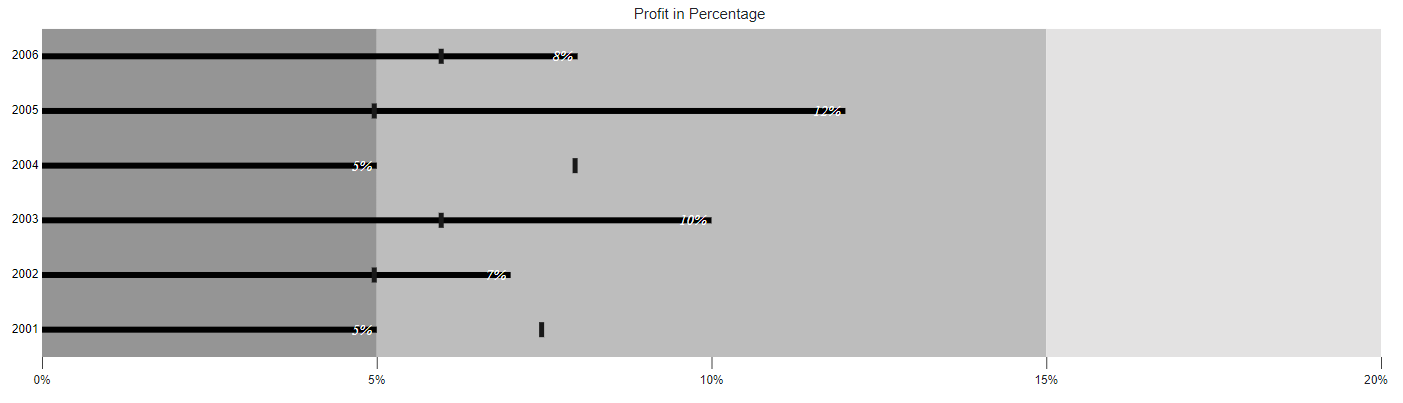
Data Labels are used to identify the value of actual bar in the Bullet Chart component. The Data Labels will be shown by specifying the DataLabel setting’s Enable property to true.
@{
    List<Data> bulletData = new List<Data>
    {
        new Data { value = 5, comparativeMeasureValue = 7.5, category= "2001"},
        new Data { value = 7, comparativeMeasureValue = 5, category= "2002"},
        new Data { value = 10, comparativeMeasureValue = 6, category= "2003"},
        new Data { value = 5, comparativeMeasureValue = 8, category= "2004"},
        new Data { value = 12, comparativeMeasureValue = 5, category= "2005"},
        new Data { value = 8, comparativeMeasureValue = 6, category= "2006"}
    };
}

<ejs-bulletchart id="bulletgraph" height="400" title="Profit in %" minimum="0" maximum="20" interval="5" categoryField="category" valueField="value" targetField="comparativeMeasureValue" dataSource="bulletData">
    <e-bullet-range-collection>
        <e-bullet-range end="5"></e-bullet-range>
        <e-bullet-range end="15"></e-bullet-range>
        <e-bullet-range end="20"></e-bullet-range>
    </e-bullet-range-collection>
    <e-bulletchart-datalabel enable="true"></e-bulletchart-datalabel>
</ejs-bulletchart>
...
public class Data
{
public double value;
public double comparativeMeasureValue;
public string category;
}Data label customization
Data Labels color, opacity, font size, font family, font weight, and font style can be customized using the LabelStyle.
@{
    List<CustomData> bulletData = new List<CustomData>
    {
        new CustomData { value = 5, comparativeMeasureValue = 7.5, category= "2001"},
        new CustomData { value = 7, comparativeMeasureValue = 5, category= "2002"},
        new CustomData { value = 10, comparativeMeasureValue = 6, category= "2003"},
        new CustomData { value = 5, comparativeMeasureValue = 8, category= "2004"},
        new CustomData { value = 12, comparativeMeasureValue = 5, category= "2005"},
        new CustomData { value = 8, comparativeMeasureValue = 6, category= "2006"}
    };
}

<ejs-bulletchart id="bulletgraph" height="400" title="Profit in %" minimum="0" maximum="20" interval="5" categoryField="category" valueField="value" targetField="comparativeMeasureValue" dataSource="bulletData">
    <e-bullet-range-collection>
        <e-bullet-range end="5"></e-bullet-range>
        <e-bullet-range end="15"></e-bullet-range>
        <e-bullet-range end="20"></e-bullet-range>
    </e-bullet-range-collection>
    <e-bulletchart-datalabel enable="true">
        <e-bulletchart-datalabel-labelstyle color="yellow" size="20"></e-bulletchart-datalabel-labelstyle>
    </e-bulletchart-datalabel>
</ejs-bulletchart>
...
public class CustomData
{
public double value;
public double comparativeMeasureValue;
public string category;
}